Trend
A trend in forex is the general direction in which a currency pair's price is moving over a specific period. Trends are classified as uptrend (higher highs and higher lows), downtrend (lower highs and lower lows), or sideways/ranging (no consistent directional bias). Identifying the trend is the foundation of technical analysis — the phrase 'the trend is your friend' encapsulates the statistical edge that trend-following strategies provide.
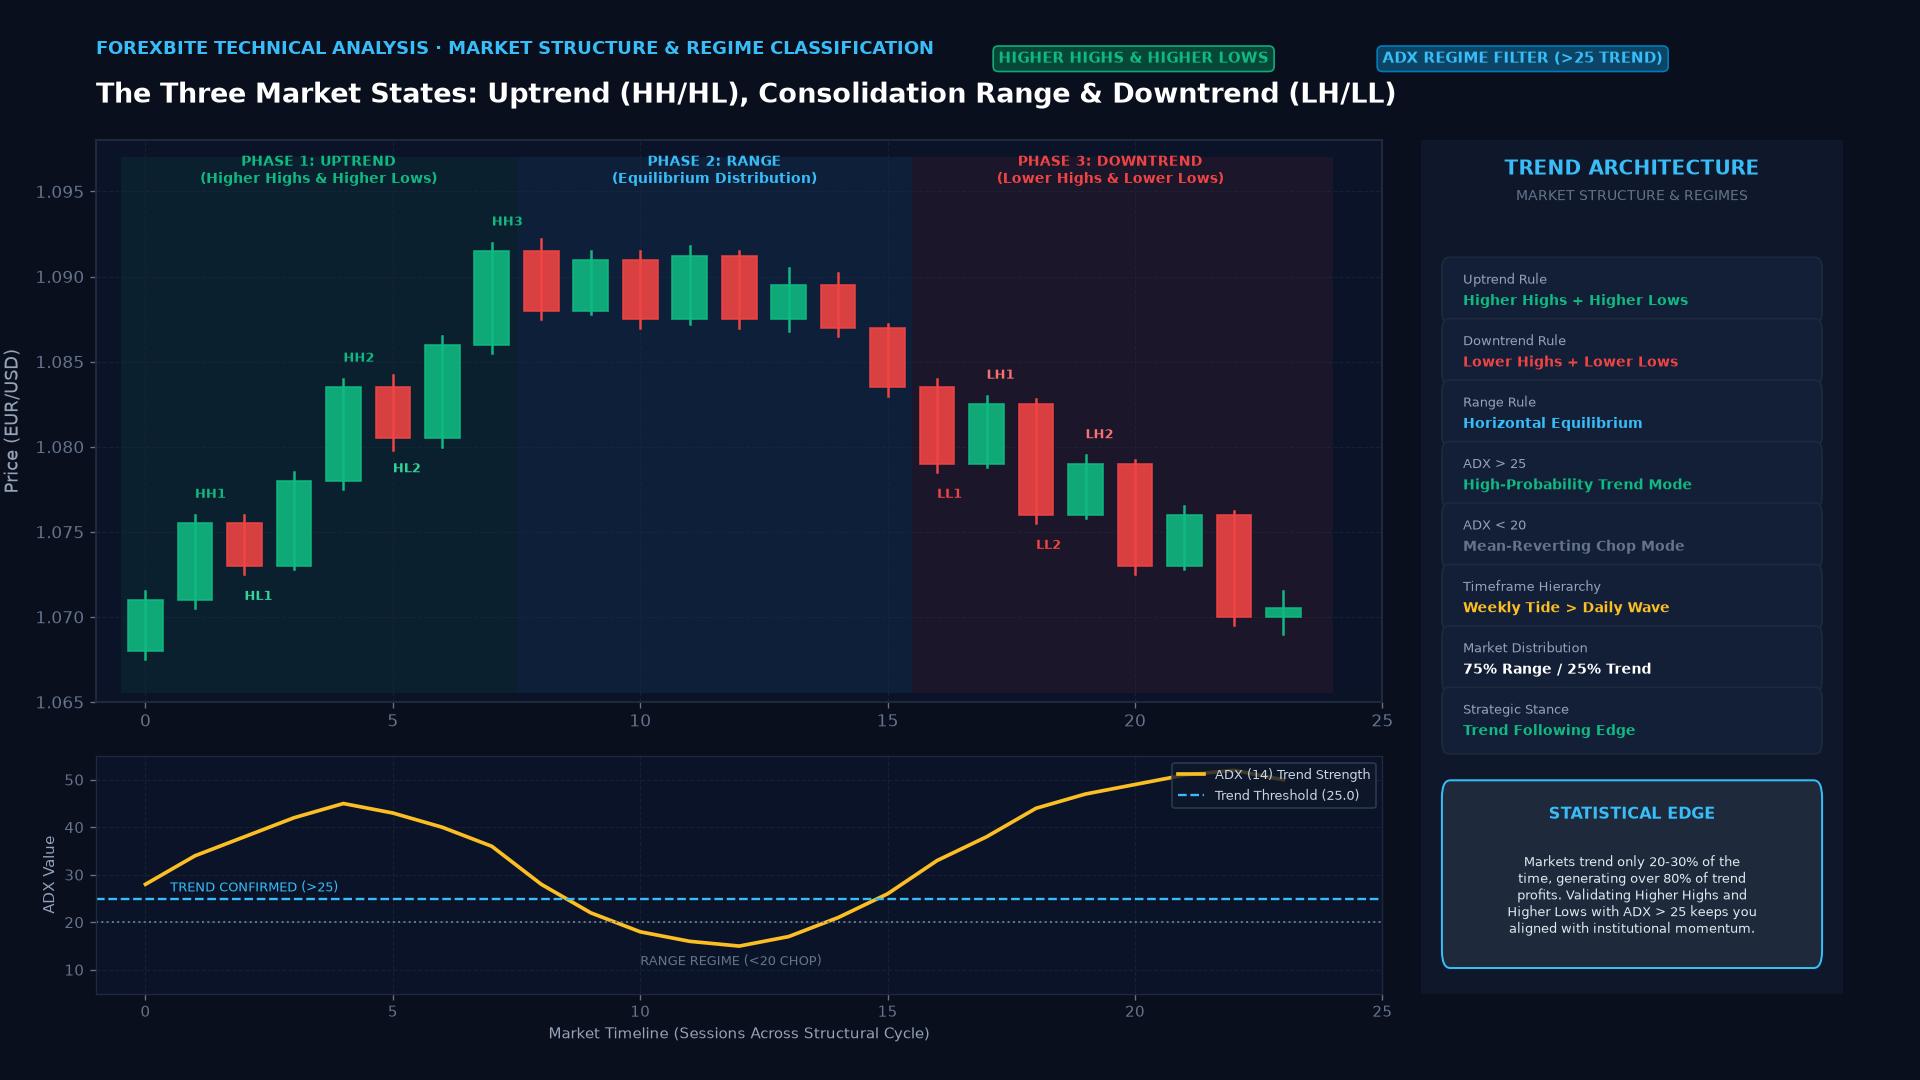
The Three States of a Market
At any given moment, a currency pair is doing one of three things: trending up, trending down, or going nowhere. These are not equal states in terms of trading opportunity.
Uptrend: A series of higher highs and higher lows. Each rally exceeds the previous rally’s peak; each pullback stays above the previous pullback’s low. The trend is intact as long as this structure holds.
Downtrend: A series of lower highs and lower lows. Each decline breaks below the previous decline’s low; each rally fails to reach the previous rally’s high. The trend is intact as long as this structure continues.
Range / Sideways: Price oscillates between a support floor and resistance ceiling without establishing a clear directional bias. Highs and lows are roughly level rather than progressively higher or lower.
Studies suggest that markets spend approximately 70-80% of their time in ranging or choppy conditions and only 20-30% in clear trends. The practical implication: trend-following strategies produce most of their returns during minority periods and must be designed to minimize losses during the ranging majority.
The Trend at Multiple Timeframes
The same currency pair can be in different trend states on different timeframes simultaneously. EUR/USD might be:
- Weekly: Uptrend (higher highs and lows over 6 months)
- Daily: Downtrend (correction within the weekly uptrend)
- 4-Hour: Uptrend (bounce within the daily downtrend)
This is not a contradiction — it’s the reality of nested market structure. A “correction” on the weekly chart is a full “bear market” on the 4-hour chart.
The professional approach uses higher timeframes to establish the primary trend direction and bias, then uses lower timeframes to find entries aligned with that bias. Buying the 4-hour correction knowing the weekly trend is upward is a far higher-probability trade than fighting the weekly trend.
Identifying Trends: The Tools
Price structure: The most reliable method. Simply identify swing highs and swing lows and determine whether they’re progressively higher or lower. No indicator needed. A series of higher highs and higher lows on the daily chart defines an uptrend with or without any indicator overlay.
Moving averages: The 20 EMA and 50 SMA are standard filters. If price is above both moving averages and both are pointing upward, the trend is up. If price is below both and both are pointing downward, the trend is down. If price is between or around the MAs without clear direction, the market is choppy.
ADX (Average Directional Index): A dedicated trend-strength indicator (0-100 scale). ADX above 25 indicates a meaningful trend; above 40 indicates a strong trend; below 20 indicates a range-bound market. The ADX doesn’t indicate direction — only trend strength. Pair it with the +DI/-DI lines to get directional bias.
Trend lines: Drawing a line connecting swing lows (in an uptrend) or swing highs (in a downtrend) creates a visual reference for trend direction and potential support/resistance. Trend lines require at minimum two confirmed points; a third touch confirms the line’s validity.
Trend vs. Range: Different Strategies Required
Trading a trend requires different tools and mindset than trading a range:
| Aspect | Trend Trading | Range Trading |
|---|---|---|
| Entry logic | Buy pullbacks / sell rallies | Buy support / sell resistance |
| Indicators | Moving averages, ADX, MACD | RSI, Stochastic, Bollinger Bands |
| Stop placement | Below recent swing low (longs) | Below support / above resistance |
| Target | Multiple R (let runners run) | Fixed target at opposite range boundary |
| Biggest mistake | Exiting too early | Holding past range breakdown |
The most dangerous thing a trader can do is apply trend-following tools in a ranging market or range-trading tools in a trending one. ADX below 20 is a signal to stop looking for breakouts and start looking for mean-reversion setups.
Trend Exhaustion Signals
All trends eventually end. Common signals that a trend is losing momentum:
- RSI divergence: Price makes new highs but RSI makes lower highs — momentum is fading
- Decreasing volume on trend extensions: Each new trend leg happens on less conviction
- Climactic move: A sudden, very fast acceleration in the trend direction often precedes reversal
- Moving average compression: Short and long-term MAs begin converging
- Failure at the trend line: Price breaks below the rising trend line on the first test
No single signal is definitive. Confluence of multiple exhaustion signals — especially on a higher timeframe — provides the most reliable warning that the trend is nearing its end.
Key Takeaways
- Three trend states: uptrend (HH/HL), downtrend (LH/LL), and range (flat S/R structure)
- Markets spend 70-80% of time ranging — design strategies that survive this majority
- Multi-timeframe trend alignment creates the highest-probability trade setups
- Price structure (swing high/low progression) is more reliable than any indicator for trend identification
- Apply trend-following tools only when ADX confirms a trend exists (ADX > 25)
FAQ
What is the difference between a primary trend and a secondary trend? Borrowed from Dow Theory: the primary trend is the major directional bias (months to years); the secondary trend is a corrective move against the primary (weeks to months). A pullback in an uptrend is a secondary downtrend within the primary uptrend. Trading the secondary trend against the primary is lower probability; trading the primary trend is higher probability.
Can trends be predicted before they start? Not reliably. Trend breakouts from ranging conditions can be anticipated using volatility compression signals (Bollinger Band squeeze, ATR at multi-month lows), but the direction of the breakout often can’t be predicted in advance. Most professional trend-followers wait for confirmation before entering, accepting they’ll miss the first portion of the move.
Ready to trade forex?
Open a free demo account with a regulated broker. Practice with virtual funds before risking real money.