AIG Performance of Service Index (Australia)
The Australian Industry Group Performance of Services Index (PSI) is a monthly macroeconomic diffusion index measuring economic activity, new orders, and employment across the Australian services sector.
What Is the Ai Group Performance of Services Index?
The Performance of Services Index (PSI), published by the Australian Industry Group (Ai Group), is a monthly macroeconomic indicator tracking operational health and commercial activity across Australia’s domestic services economy. While legacy scraper databases sometimes confuse the acronym with the American International Group insurance conglomerate, the index is produced exclusively by the Australian Industry Group, the nation’s premier independent employer and industry association.
Because the services sector generates more than 70% of Australia’s Gross Domestic Product (GDP) and employs over 80% of the national workforce, the PSI serves as a primary leading indicator for economists, equity analysts, and foreign exchange (Forex) participants trading the Australian Dollar (AUD). It offers the earliest monthly reading on domestic demand, pricing pressure, and labor market momentum ahead of official government data releases from the Australian Bureau of Statistics (ABS).
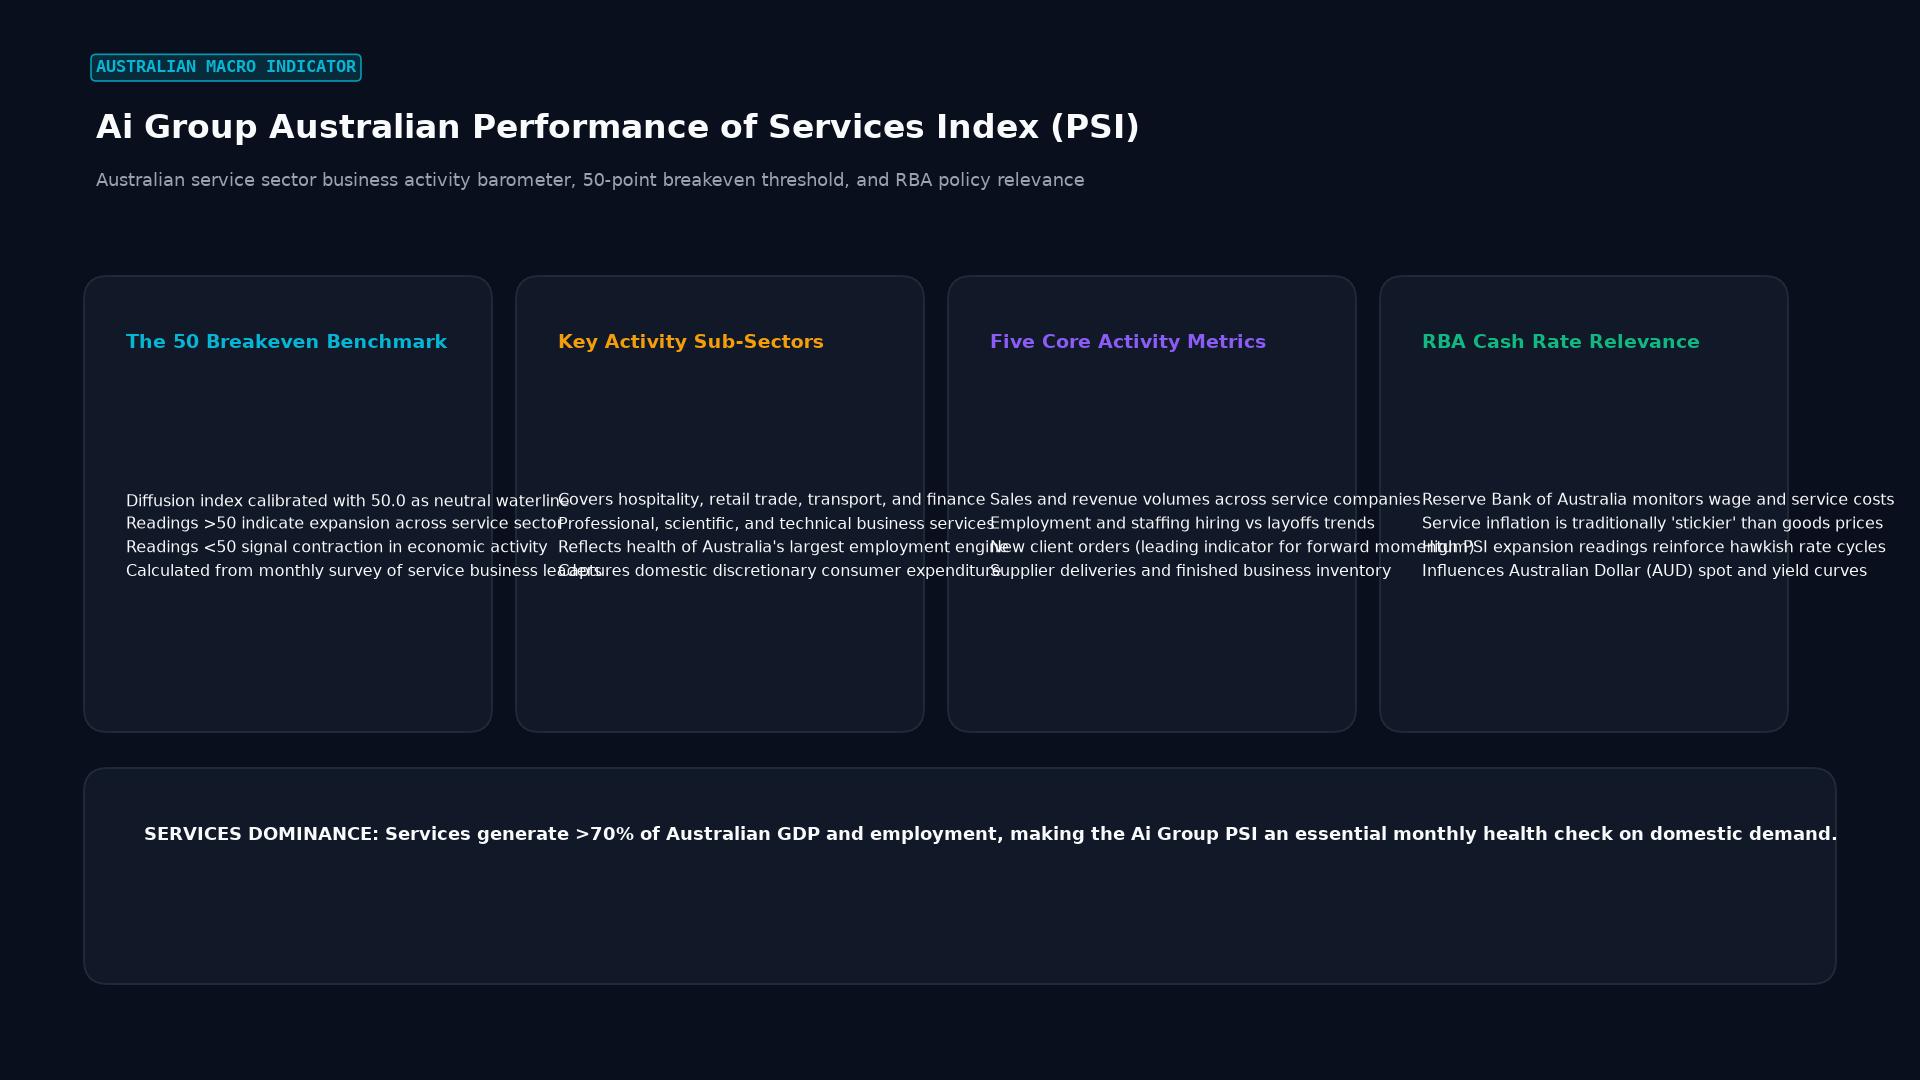 Figure: Australian service sector business activity barometer, 50-point breakeven threshold, and RBA policy relevance
Index Methodology: The 50.0 Diffusion Threshold
The Performance of Services Index is constructed as a diffusion index, following the standard methodology employed by global purchasing managers’ surveys:
- Survey Scope: Senior executives across diverse service sub-sectors (including business and property services, finance and insurance, wholesale trade, retail, hospitality, transport, and health services) report whether commercial conditions have expanded, remained unchanged, or declined compared to the prior month.
- The 50.0 Benchmark:
- A headline reading above 50.0 indicates that the services economy is expanding.
- A headline reading below 50.0 indicates contraction.
- A reading of exactly 50.0 denotes no change in aggregate activity.
- The distance of the index from 50.0 indicates the speed and intensity of the expansion or contraction.
Ai Group Diffusion Index Scale:
┌────────────────────────────────────────┬────────────────────────────────────────┐
│          CONTRACTION ZONE              │             EXPANSION ZONE             │
│ (Activity Declining / Economic Drag)   │ (Activity Expanding / Growth Momentum) │
├────────────────────────────────────────┼────────────────────────────────────────┤
│ 0                    35             50.0             65                    100  │
└────────────────────────────────────────┴────────────────────────────────────────┘
                                          ▲
                               Baseline Neutral Level
The composite headline index is calculated from five weighted activity sub-indexes: Sales, Employment, New Orders, Supplier Deliveries, and Finished Stocks. In addition, the survey tracks critical inflation inputs, including average wages, input price inflation, and final selling prices.
Forex Market Transmission: How the PSI Affects the Australian Dollar
Foreign exchange traders monitor the Ai Group PSI release closely around the third or fourth business day of each month. Because the Reserve Bank of Australia (RBA) maintains an inflation-targeting monetary policy framework, services sector data directly impacts interest rate expectations:
Macroeconomic Transmission Flow to AUD Currency Pairs:
┌────────────────────────────────────────────────────────┐
│ Ai Group PSI Released (Beats Consensus / Above 50.0)   │
└──────────────────────────┬─────────────────────────────┘
                           │
             ┌─────────────┴─────────────┐
             ▼                           ▼
 ┌───────────────────────┐   ┌───────────────────────────┐
 │ Rising Services Wages │   │ Robust Consumer Demand    │
 │ & Firm Selling Prices │   │ & High New Business Orders│
 └───────────┬───────────┘   └───────────┬───────────────┘
             │                           │
             └─────────────┬─────────────┘
                           ▼
 ┌────────────────────────────────────────────────────────┐
 │ Reserve Bank of Australia (RBA) Maintains Hawkish Bias │
 │ Cash rate held elevated to cool domestic service costs │
 └─────────────────────────┬──────────────────────────────┘
                           │
                           ▼
 ┌────────────────────────────────────────────────────────┐
 │ Australian Dollar (AUD) Appreciates Globally           │
 │ (AUD/USD and AUD/JPY Surge Higher on Yield Advantage)  │
 └────────────────────────────────────────────────────────┘
Conversely, if the index plunges below 45.0, signaling accelerating contraction across service businesses, institutional funds price in future RBA rate cuts, triggering rapid depreciation in AUD crosses.
Comparison: Ai Group PSI vs. Other Australian Indicators
Macro analysts evaluate the Ai Group PSI alongside complementary economic benchmarks:
| Economic Indicator | Publishing Entity | Sample Focus | Analytical Role |
|---|---|---|---|
| Ai Group PSI | Australian Industry Group | Services sector businesses | Leading monthly activity & wage pulse |
| Ai Group PMI | Australian Industry Group | Heavy manufacturing & industrial | Leading manufacturing cycle gauge |
| NAB Business Confidence | National Australia Bank | Economy-wide corporate sentiment | Broad corporate capex outlook |
| ABS Retail Sales | Australian Bureau of Statistics | Consumer retail spending volume | Official lagging consumer hard data |
| S&P Global Australia PMI | S&P Global / Judo Bank | Dual manufacturing & services | International cross-country benchmark |
While ABS data releases provide audited official figures, they are published with significant time lags. The Ai Group PSI provides immediate, real-time insight into the economy weeks before official quarterly GDP figures are tabulated.
Key Takeaways
- The Performance of Services Index is published monthly by the Australian Industry Group (Ai Group), not American International Group.
- It tracks the Australian services economy, which accounts for over 70% of national GDP and four out of five domestic jobs.
- Readings above 50.0 indicate sector expansion, while readings below 50.0 signal contraction.
- The index is a leading economic indicator used by currency traders to forecast Reserve Bank of Australia interest rate decisions and AUD exchange rate moves.
Frequently Asked Questions
Why is the services index more influential for Australian GDP than the manufacturing index?
While Australia is famous for its mining, energy, and agricultural commodity exports, the domestic services sector represents the vast majority of economic output and employment. A slowdown in services threatens household consumption and national employment far more directly than fluctuations in domestic factory output.
At what time is the Ai Group PSI released?
The Australian Industry Group releases the PSI report monthly, typically at 8:30 AM or 9:30 AM Australian Eastern Time, during the opening hours of the Sydney trading session.
How do commodity prices interact with the Ai Group PSI?
High global prices for Australian iron ore, coal, and liquefied natural gas (LNG) boost mining corporate profits and government tax receipts. This wealth circulates into the broader domestic economy, stimulating demand for business consulting, financial engineering, transport logistics, and consumer hospitality captured by the PSI.
Ready to trade forex?
Open a free demo account with a regulated broker. Practice with virtual funds before risking real money.