Action
Action in financial markets refers to the observable directional movement of price, volume, and volatility over time (price action), as well as corporate events initiated by a public firm that alter its capital structure (corporate actions).
What Is Action in Financial Markets?
In financial trading, technical analysis, and market microstructure, the term Action operates across two distinct domains:
- Price Action & Market Action: The observable behavior, velocity, volume, and tick-by-tick trajectory of an asset’s quote across time. In forex and futures trading, market participants analyze raw price action to interpret institutional order flow, liquidity imbalances, and trend momentum without cluttering charts with lagging mathematical indicators.
- Corporate Action: An official event initiated by the board of directors or executive management of a publicly traded corporation that directly impacts its shareholders and alters its capital structure, such as stock splits, dividends, spin-offs, or rights offerings.
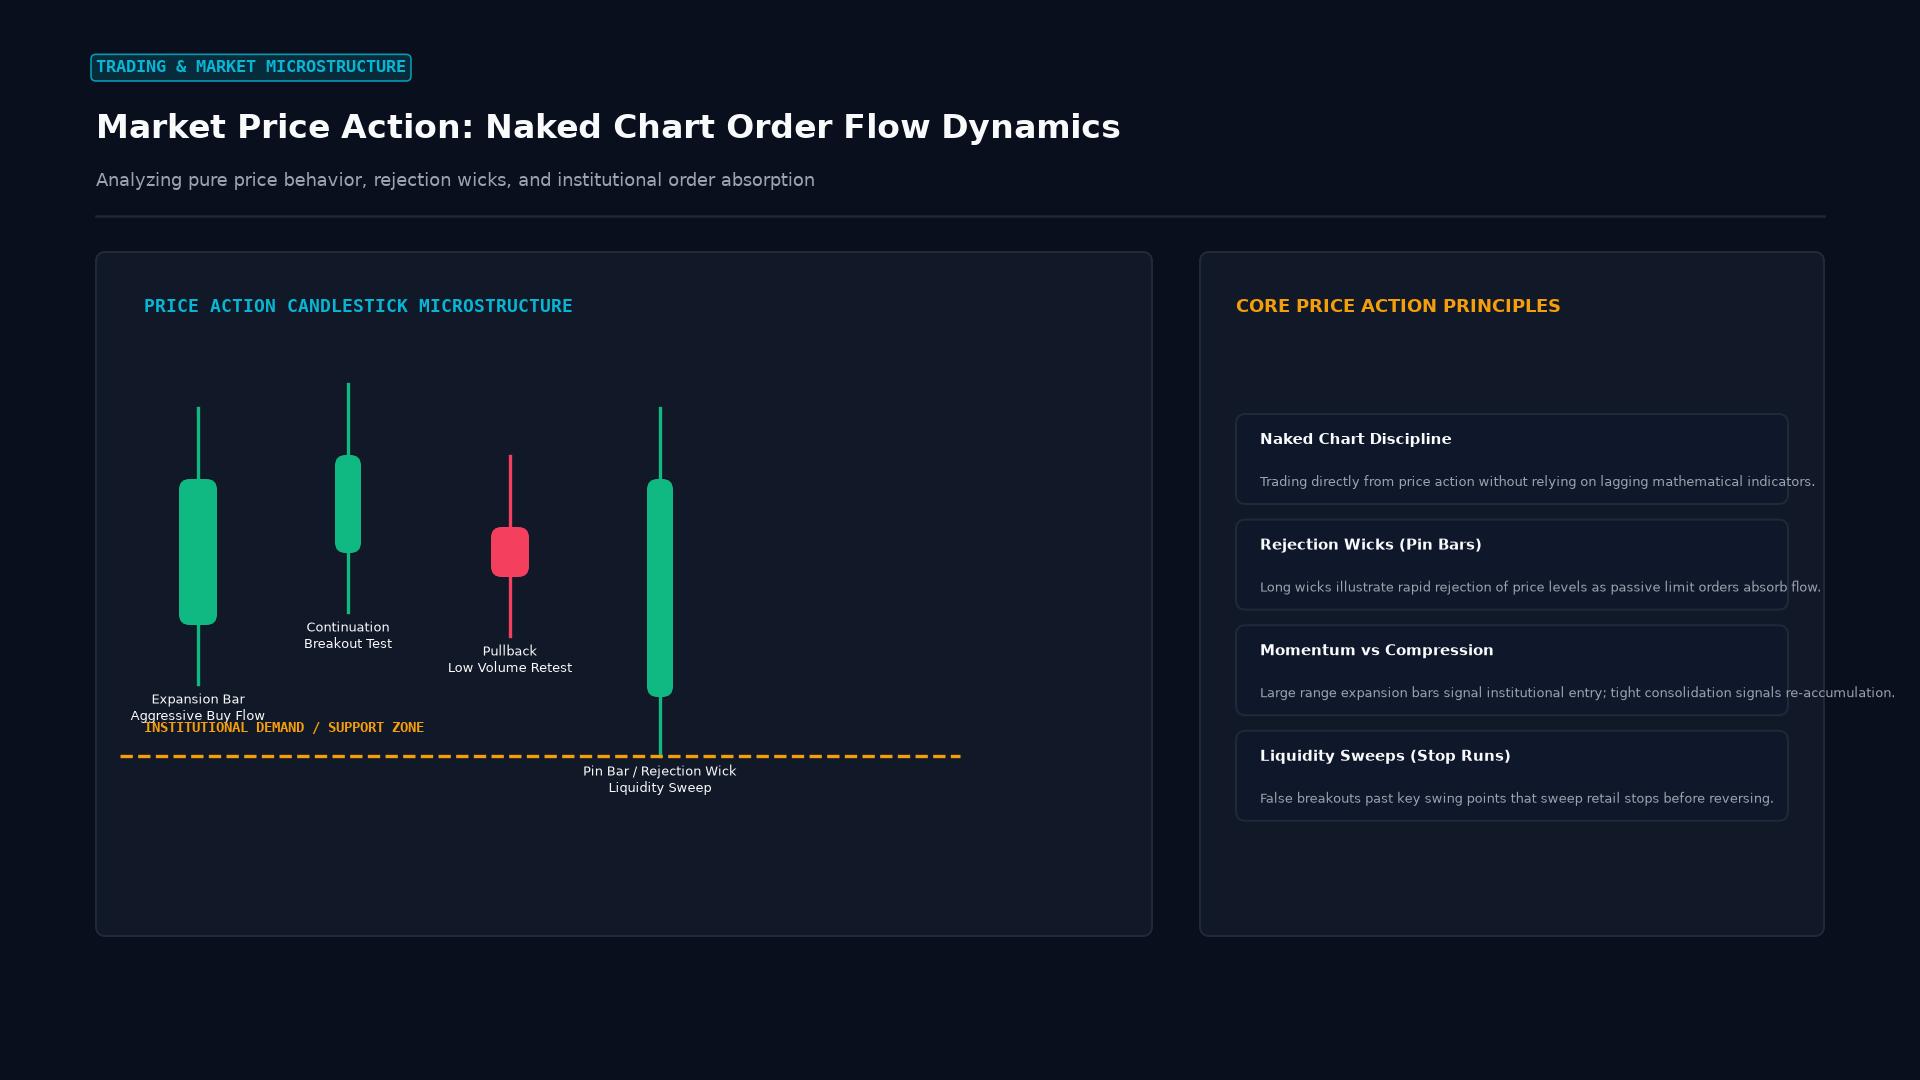 Figure: Price action candlestick dynamics: expansion bars, compression consolidation, rejection wicks (pin bars), and institutional liquidity sweeps without lagging indicators.
Technical Mechanics: Price Action Trading
Price action trading is an analytical methodology that studies naked candlestick charts to understand the psychological battle between institutional buyers and sellers:
1. Market Structure and Swing Sequences
At its foundational level, price action is categorized by structural swing points:
- Bullish Trend Structure: Defined by a consistent sequence of Higher Highs (HH) and Higher Lows (HL). Institutional buyers step in aggressively at previously broken resistance levels (support-resistance flips).
- Bearish Trend Structure: Defined by a consistent sequence of Lower Lows (LL) and Lower Highs (LH).
- Range-Bound (Consolidation): Price oscillates horizontally between a defined support floor and resistance ceiling as liquidity pools accumulate on both sides.
2. High-Probability Candlestick Signatures
Price action traders look for specific bar formations that signal supply and demand absorption:
- The Rejection Pin Bar (Hammer / Shooting Star): Features a long shadow (wick) that penetrates a key technical level and a small real body closing near the opposite end, revealing that aggressive liquidity swept the level and reversed.
- The Engulfing Bar (Outside Bar): The current session’s real body completely envelops the preceding session’s body, signaling a violent shift in market sentiment.
- Inside Bar: The entire price range sits inside the preceding bar’s high and low, signaling temporary volatility compression preceding an explosive momentum breakout.
Technical Mechanics: Corporate Actions in Equity Markets
When a public corporation initiates an action, exchange clearinghouses and brokerage firms execute mechanical portfolio adjustments:
1. Mandatory Corporate Actions
Actions initiated by the board that apply automatically to all registered shareholders:
- Stock Splits: A 2-for-1 stock split doubles the number of shares held by each investor while halving the per-share market price, maintaining identical total portfolio value while enhancing retail share liquidity.
- Cash Dividends: The per-share dividend amount is deducted from the stock price on the morning of the ex-dividend date to reflect the cash distribution leaving the corporate balance sheet.
- Spin-Offs: The parent company distributes shares of a newly created independent subsidiary directly to existing stockholders.
2. Voluntary Corporate Actions
Actions where each individual shareholder chooses if they wish to participate:
- Tender Offers: A buyout group or the corporation offers to purchase shares directly from stockholders at a specified premium price before a set expiration deadline.
- Rights Offerings: Existing shareholders receive subscription warrants granting the right to purchase newly issued common shares at a discount to prevailing market prices.
Comparative Matrix: Price Action vs. Indicator-Based Trading
| Trading Dimension | Price Action Methodology | Traditional Indicator-Based Trading |
|---|---|---|
| Data Source | Pure, unfiltered tick-by-tick OHLC prices | Derived mathematical averages of past closes |
| Signal Timing | Leading / Real-time at key liquidity levels | Lagging; requires time for moving averages to cross |
| Chart Cleanliness | Clean naked charts with horizontal levels | Cluttered with MACD, RSI, Stochastics, Bands |
| False Signals | Requires subjective skill to filter wicks | Generates frequent whipsaws in ranging markets |
| Institutional Alignment | Mirrors how institutional order books execute | Relies on retail technical indicators |
Real-World Case Study: EUR/USD Price Action Breakout Trade
In October 2024, the EUR/USD currency pair spent 18 trading days consolidating in a tight 65-pip horizontal range between support at 1.0810 and resistance at 1.0875. During this compression, volume drifted downward while retail traders were caught in alternating whipsaw moves.
A professional price action trader monitored the chart:
- The Liquidity Sweep: On October 22, during the Asian session, price spiked down to 1.0795, piercing the established 1.0810 support by 15 pips to trigger retail stop-loss orders.
- The Reversal Confirmation: Within three hours, institutional buying absorbed the supply. The daily candle closed at 1.0860, printing a massive bullish hammer (pin bar) with a long lower rejection wick.
- Execution: The trader initiated a long position at the market open following the pin bar close, placing a protective stop 10 pips below the sweep low at 1.0785.
- The Expansion: Over the next 48 hours, EUR/USD shattered the 1.0875 resistance ceiling, surging 160 pips to test 1.0970, generating a 3.5-to-1 risk-to-reward return using pure price action principles.
Frequently Asked Questions (FAQ)
What is the difference between price action and technical analysis?
Price action is a specific discipline within technical analysis. While broader technical analysis includes complex mathematical algorithms, cycles, and lagging indicators, price action focuses strictly on raw prices, candlestick patterns, trendlines, and support/resistance zones.
How do corporate actions affect stock options contracts?
The Options Clearing Corporation (OCC) adjusts standardized options contracts when a company executes a corporate action (such as a stock split or special dividend). The OCC issues an adjustment memo adjusting the strike prices, deliverable shares per contract, or contract multipliers to ensure the option contract retains its exact economic value.
Can price action be applied to lower timeframes like 1-minute and 5-minute charts?
While price action principles apply to all timeframes, lower timeframes contain substantial market noise generated by high-frequency trading algorithms, algorithmic scalpers, and spread variance. Most professional price action traders base primary analysis on 4-hour, daily, and weekly charts, utilizing 15-minute charts strictly for trade entry timing.
Ready to trade forex?
Open a free demo account with a regulated broker. Practice with virtual funds before risking real money.