Break of Which
A technical analysis and order flow trading concept describing the market dynamic where the decisive breach of a primary support or resistance level triggers a rapid, cascading price movement toward the next sequential structural price barrier.
What is a “Break of Which”?
In technical analysis and algorithmic price action trading, the phrase “break of which” refers to a conditional market milestone where the penetration of a critical price threshold triggers an immediate, self-reinforcing directional expansion toward the next logical support or resistance zone.
Market analysts and systematic traders frequently structure trade plans around sequential “if-then” conditional statements:
“EUR/USD is testing major structural support at 1.0800, a break of which will target the October liquidity pool at 1.0720, followed by the psychological 1.0650 handle.”
Far from being mere chartist jargon, a “break of which” represents a profound shift in underlying order book mechanics. Key chart levels act as structural dams holding back concentrated clusters of pending orders. When the level finally gives way, the sudden imbalance between aggressive market orders and thin resting counterparty liquidity creates rapid price acceleration.
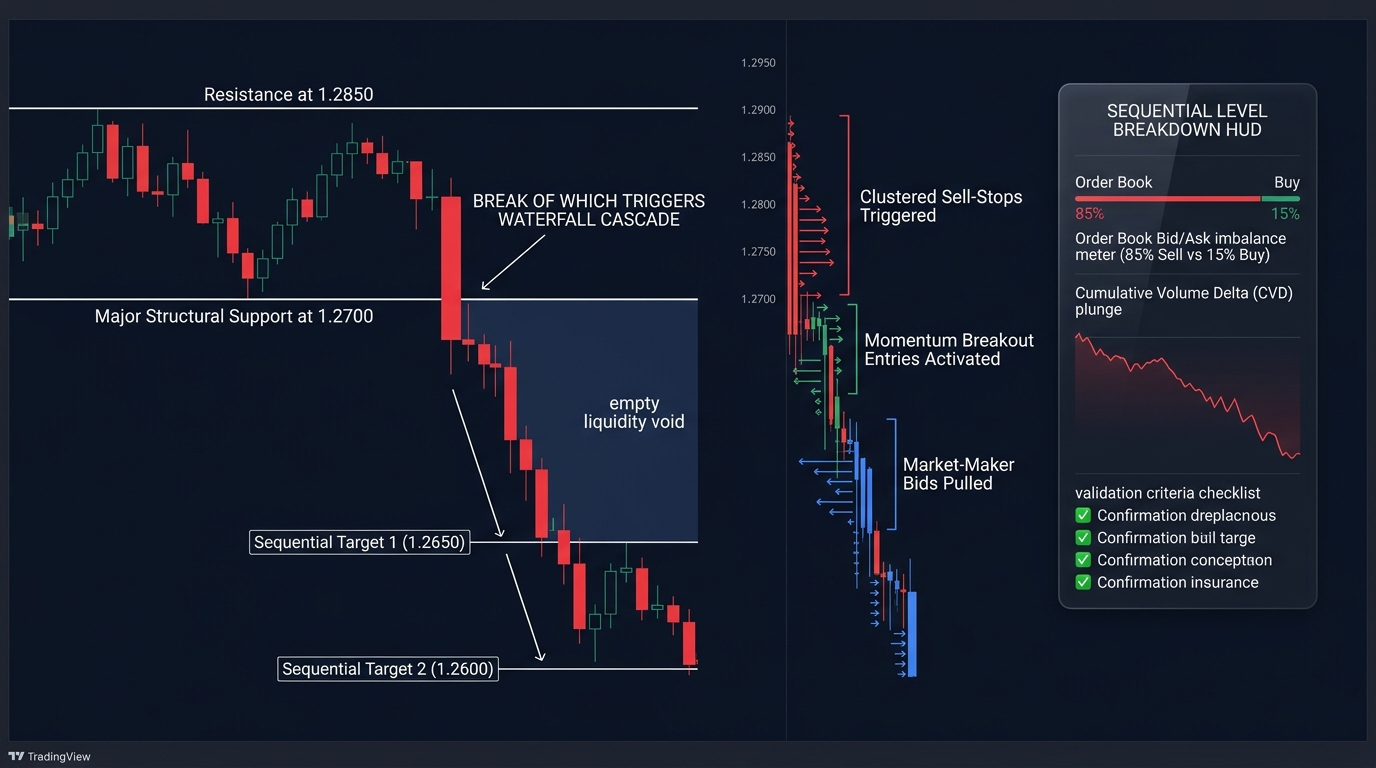
Order Flow Microstructure: Why Price Cascades After a Break
A sudden price surge following the break of a key level is driven by four concurrent order flow catalysts:
- Stop-Loss Execution Cascades: Traders who bought the asset near support logically position their protective stop-losses just beneath that level. Because stop-loss orders on long positions are unpriced market sell orders, breaching the support line triggers a cascading avalanche of automated selling.
- Breakout Momentum Orders (Stop-Entry Orders): Systematic breakout algorithms and momentum traders place pending “Sell Stop” orders just below support to jump aboard the emerging trend. When the level is tagged, these orders convert into aggressive sell orders, adding massive downside fuel.
- Passive Liquidity Evaporation (Market-Maker Retreat): Institutional market makers recognize when a key level is breaking. Rather than stepping in front of a falling knife, they widen their spreads and pull their bids down to the next major technical support zone, creating a temporary liquidity vacuum.
- Buyer Capitulation: Traders attempting to defend the support level realize their hypothesis is invalidated and abandon their bids, eliminating any remaining floor.
Validating a Clean Break vs. False Breakout (The Trap)
One of the greatest hazards in trading level breakouts is the false breakout (commonly termed a whipsaw, bear trap, or liquidity sweep). Institutional algorithms frequently push prices temporarily through an obvious support level solely to trigger retail stop-losses and absorb liquidity before violently reversing in the opposite direction.
| Technical Dimension | High-Probability Genuine Break | False Breakout (Liquidity Sweep) |
|---|---|---|
| Candle Close Confirmation | Full body closes decisively outside the level on higher timeframes (H1, H4, Daily). | Long wick extends past level, but candle body closes back inside the range. |
| Volume & Order Flow | Surge in aggressive Volume Delta and expanding Cumulative Volume Delta (CVD). | High tick volume accompanied by immediate absorption and reversing delta. |
| Retest Dynamics | Prior support cleanly retested as new resistance before continuing lower. | Immediate aggressive rejection back into the prior trading range. |
| Market Depth (DOM) | Bids evaporate, and resting ask liquidity stacks above the broken level. | Heavy bids rapidly reload just below the level, absorbing all selling. |
Step-by-Step Trading Walkthrough: GBP/USD Support Breakdown
Consider an intraday currency trader observing GBP/USD ahead of a Bank of England monetary policy announcement:
The Technical Scenario
- Primary Support: 1.2700 (Tested three times over the past 48 hours).
- Sequential Target 1: 1.2640 (Prior weekly swing low).
- Sequential Target 2: 1.2580 (Major daily ascending trendline).
Trade Plan and Execution
- The Catalyst: The central bank delivers a surprisingly dovish policy statement. Spot GBP/USD plunges toward 1.2700.
- The Break of Which: At 12:02 PM, price pierces 1.2700. A cluster of retail stops is hit, and the 15-minute candle closes decisively at 1.2685.
- Target 1 Reached: The momentum sweep carries price straight to 1.2640 within 25 minutes, where profit-taking temporarily pauses the decline.
- Secondary Breakout: After a brief 15-pip consolidation, sellers break through 1.2640—a “break of which” triggers the second phase of the cascade, fulfilling the macro target at 1.2580.
By establishing clear contingent rules around sequential levels, the trader captures the highest-velocity portion of the market move without guessing at arbitrary reversal points.
Multi-Timeframe Level Hierarchy
When structuring “break of which” trading frameworks, the significance of the price level dictates the velocity and magnitude of the subsequent move:
- Macro Daily / Weekly Levels: A break of a multi-month support or resistance level triggers multi-week institutional portfolio realignments, producing trends spanning 200 to 500 pips.
- Session Highs and Lows (London / New York Opens): Breaching the Asian session high or low typically triggers an intraday liquidity run of 30 to 70 pips.
- Psychological Round Numbers: Levels ending in double or triple zeros (e.g., EUR/USD at 1.1000 or USD/JPY at 155.00) concentrate massive options open interest and retail orders, ensuring heightened volatility upon breach.
Key Takeaways
- “Break of which” describes a technical condition where penetrating a pivotal support or resistance level activates a cascade toward the next established chart zone.
- Cascades are propelled by clustered stop-loss liquidations, breakout entry orders, and the retreat of passive market-maker bids.
- Waiting for candle-body closes on higher timeframes (H1 or H4) protects traders from predatory liquidity sweeps and false breakouts.
- Sequential level targeting allows traders to capture rapid momentum expansions while establishing objective, structural stop-loss anchors.
- Combining price-level breaks with volume delta and footprint analysis confirms whether institutional capital is genuinely backing the breakout.
Frequently Asked Questions
What should a trader do immediately after a level breaks?
Rather than chasing the market aggressively at the bottom or top of a large breakout candle, seasoned traders often wait for a retest. In a bearish break, price frequently pulls back to retest the broken support level from underneath (flipping it into resistance), offering a superior risk-reward entry.
How do trailing stops help in a “break of which” strategy?
As price breaks through sequential levels (e.g., Level 1 $\to$ Level 2 $\to$ Level 3), traders trail their stop-loss behind each newly broken level. This locks in accumulated profits while keeping the trade open to capture further cascading momentum.
Why do institutional traders look for obvious support levels?
Large institutions manage billions in capital and cannot enter or exit large positions without massive slippage. Obvious support levels hold vast concentrations of resting stop-loss orders. Institutions push prices through these levels to generate the massive liquidity required to fill their institutional orders.
Can Fibonacci levels be used in “break of which” analysis?
Yes. Traders frequently monitor key Fibonacci retracements (such as the 61.8% golden ratio). A “break of which” signals that the price move is no longer a corrective pullback, but rather a complete structural trend reversal targeting the 100% or 161.8% extension levels.
Ready to trade forex?
Open a free demo account with a regulated broker. Practice with virtual funds before risking real money.