Momentum
Momentum in financial markets is the rate of change or velocity of price movements, reflecting the empirical tendency of strongly trending currencies to continue moving in their prevailing direction before exhausting their underlying energy.
Momentum is the velocity of price movement over a given timeframe. Originating as a concept in classical physics—where an object in motion tends to stay in motion unless acted upon by an external force—momentum in financial markets describes the persistence of directional price trends.
When institutional capital aggressively reallocates funds into a currency, the resulting order flow creates sustained directional velocity. Currency traders analyze momentum to determine not only where an exchange rate is heading, but how quickly it is traveling and whether that move is gaining or losing strength.
The Mechanics Behind Market Momentum
Financial markets do not move in frictionless vacuums. Momentum persists in currency pairs due to three primary market microstructure drivers:
- Institutional Execution Over Time: Sovereign wealth funds, multinational corporations, and central banks transact billions of dollars. Because dumping such vast liquidity into the market at once would cause extreme slippage, institutional execution algorithms break orders into smaller tranches over hours or days, creating sustained directional momentum.
- Systematic and Trend-Following Funds: Commodity Trading Advisors (CTAs) and quantitative hedge funds manage hundreds of billions of dollars using algorithmic models that automatically add leverage to assets displaying strong positive momentum.
- Behavioral Bandwagon Effect: As retail and proprietary desk traders observe a strong breakout on their charts, fear of missing out (FOMO) prompts them to jump onto the moving trend, further fueling the directional impulse.
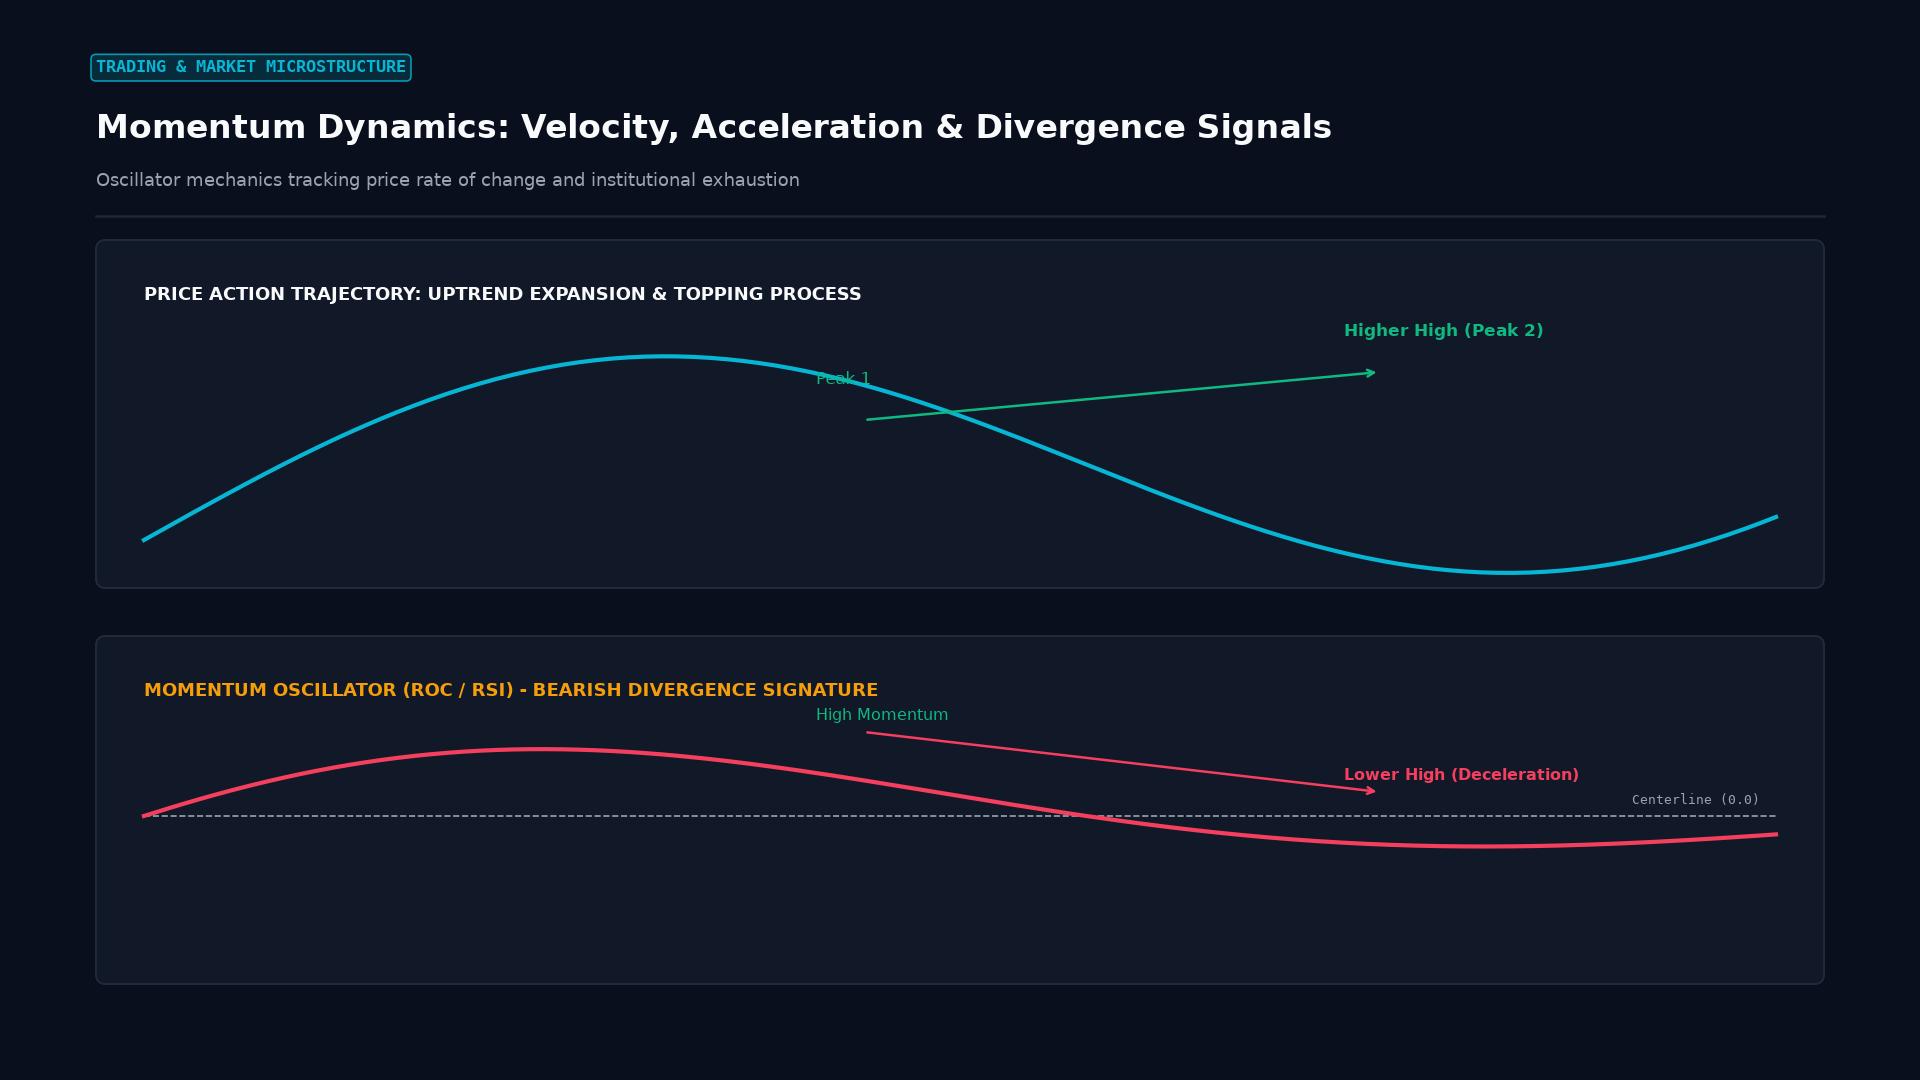 Figure: Oscillator mechanics tracking price rate of change: detecting bullish expansion, velocity exhaustion, and bearish divergence topping patterns.
Measuring Momentum: Indicators and Formulas
Traders quantify momentum using mathematical indicators designed to measure price velocity relative to a historical baseline:
1. The Classical Momentum Oscillator
The pure momentum indicator calculates the absolute arithmetic difference between the current price and the price $N$ periods ago:
$$\text{Momentum} = \text{Price}t - \text{Price}{t-N}$$
Alternatively, it can be expressed as a ratio centered around 100:
$$\text{Momentum Ratio} = \left(\frac{\text{Price}t}{\text{Price}{t-N}}\right) \times 100$$
A reading above 100 indicates prices are higher than they were $N$ periods ago and rising; a reading below 100 indicates declining price levels.
2. Rate of Change (ROC)
The ROC oscillator translates momentum into a pure percentage:
$$\text{ROC} = \left(\frac{\text{Price}t - \text{Price}{t-N}}{\text{Price}_{t-N}}\right) \times 100$$
3. Popular Momentum-Derived Indicators
| Indicator | Type | What It Measures | Best Used For |
|---|---|---|---|
| RSI (Relative Strength Index) | Bounded Oscillator (0-100) | Ratio of average gains to average losses | Spotting overbought/oversold extremes and divergence |
| MACD | Trend/Momentum Hybrid | Distance between 12- and 26-period EMAs | Trend acceleration and crossover triggers |
| Stochastic Oscillator | Bounded Oscillator (0-100) | Current close relative to high-low range over $N$ periods | Pinpointing cycle turns in range-bound markets |
| ADX (Average Directional Index) | Unbounded Strength Gauge | Absolute strength of a trend regardless of direction | Distinguishing trending markets from range chop |
Reading Momentum via Pure Price Action
While mathematical indicators are useful, seasoned price-action traders observe momentum directly on raw candlestick charts:
- Candlestick Size and Body-to-Wick Ratio: Long-bodied candles (marubozu) that close near their absolute highs or lows indicate that one side of the market is in total control. Minimal wicks signal that opposing orders were quickly overwhelmed.
- Consecutive Closes: When multiple consecutive candles close beyond the previous candle’s range without meaningful pullbacks, directional velocity is high.
- Angle and Slope: A moving average or price channel that slopes upward at a steep 45-degree to 60-degree angle demonstrates robust institutional sponsorship compared to a flat, choppy 15-degree slope.
Practical Example: A High-Momentum Breakout on USD/JPY
Consider USD/JPY consolidating in a tight 30-pip range between 154.20 and 154.50 ahead of a Bank of Japan (BoJ) interest rate announcement:
- The Catalyst: The BoJ unexpectedly holds rates steady and maintains a dovish forward guidance outlook, while U.S. Treasury yields spike.
- Momentum Ignition: Within the first five minutes of the news release, a large 15-minute bullish candle bursts through horizontal resistance at 154.50, closing at 155.10 (a 60-pip expansion). The Rate of Change (ROC) surges from $+0.1%$ to $+1.4%$, and volume spikes to triple its daily average.
- Trade Setup: A momentum breakout trader avoids fading this explosive move. Instead, they enter long on the initial minor pullback:
- Entry: Long at 155.00 as price briefly retests the broken resistance-turned-support level.
- Stop-Loss: Placed at 154.55, just below the breakout zone (risking 45 pips).
- Take-Profit: Targeted at 156.35, the next higher-timeframe resistance zone (targeting 135 pips).
- Outcome: Strong momentum carries USD/JPY upward with minimal retracement over the next eight hours, hitting 156.35 for a 3:1 reward-to-risk gain.
The Risks of Momentum: Climax Runs and False Breakouts
Momentum is a double-edged sword. While it creates the most profitable runs in currency trading, late entries into overextended trends expose traders to sharp reversals:
- Blow-Off Tops / Exhaustion Climaxes: When a currency pair goes parabolic (accelerating vertically), the final price surge often represents retail capitulation and short squeezes rather than fresh institutional buying. Smart money uses this peak liquidity to exit positions, resulting in violent V-shaped reversals.
- Momentum Divergence: When price continues to make new highs, but momentum oscillators print lower peaks, the fuel driving the move is exhausted, warning that a deep correction is imminent.
Key Takeaways
- Market Velocity: Momentum measures the speed and persistence of price changes over a specified lookback window.
- Institutional Fuel: Directional momentum is generated primarily by massive institutional order flow and algorithmic trend-following strategies.
- Indicator Suite: Popular tools to measure momentum include ROC, RSI, MACD, and the Average Directional Index (ADX).
- Price Action Clues: Wide-range candles closing near extremes with short wicks provide direct visual evidence of strong momentum.
- Exhaustion Awareness: Parabolic acceleration frequently signals trend exhaustion and blow-off tops, making risk-reward unfavorable for late entrants.
Frequently Asked Questions
What is the difference between trend and momentum?
A trend describes the overall direction of an asset’s price over time (uptrend, downtrend, or sideways). Momentum measures the speed and strength with which price moves in that direction. A market can be in an uptrend while momentum is decelerating, warning of an impending top.
Can momentum indicators predict market turns?
Momentum indicators do not predict the future, but they identify exhaustion. When momentum decelerates while price continues to push higher (bearish divergence), it signals that buying pressure is waning, increasing the odds of a reversal or consolidation.
Which timeframe is best for momentum trading in forex?
Momentum strategies function across all timeframes. Day traders capitalize on momentum during the high-liquidity London and New York overlaps (e.g., on 5-minute and 15-minute charts), while macro swing traders ride multi-week momentum on daily and weekly charts driven by central bank interest rate trends.
Ready to trade forex?
Open a free demo account with a regulated broker. Practice with virtual funds before risking real money.