Daily Low
The daily low is the lowest market price reached by an asset during a trading day, representing the maximum extent of selling pressure and the inflection point where buying liquidity halted the decline.
What Is the Daily Low?
In financial market technical analysis, the daily low (abbreviated as L in standard OHLC data series) represents the minimum transaction price recorded for a financial instrument over the course of a 24-hour trading session.
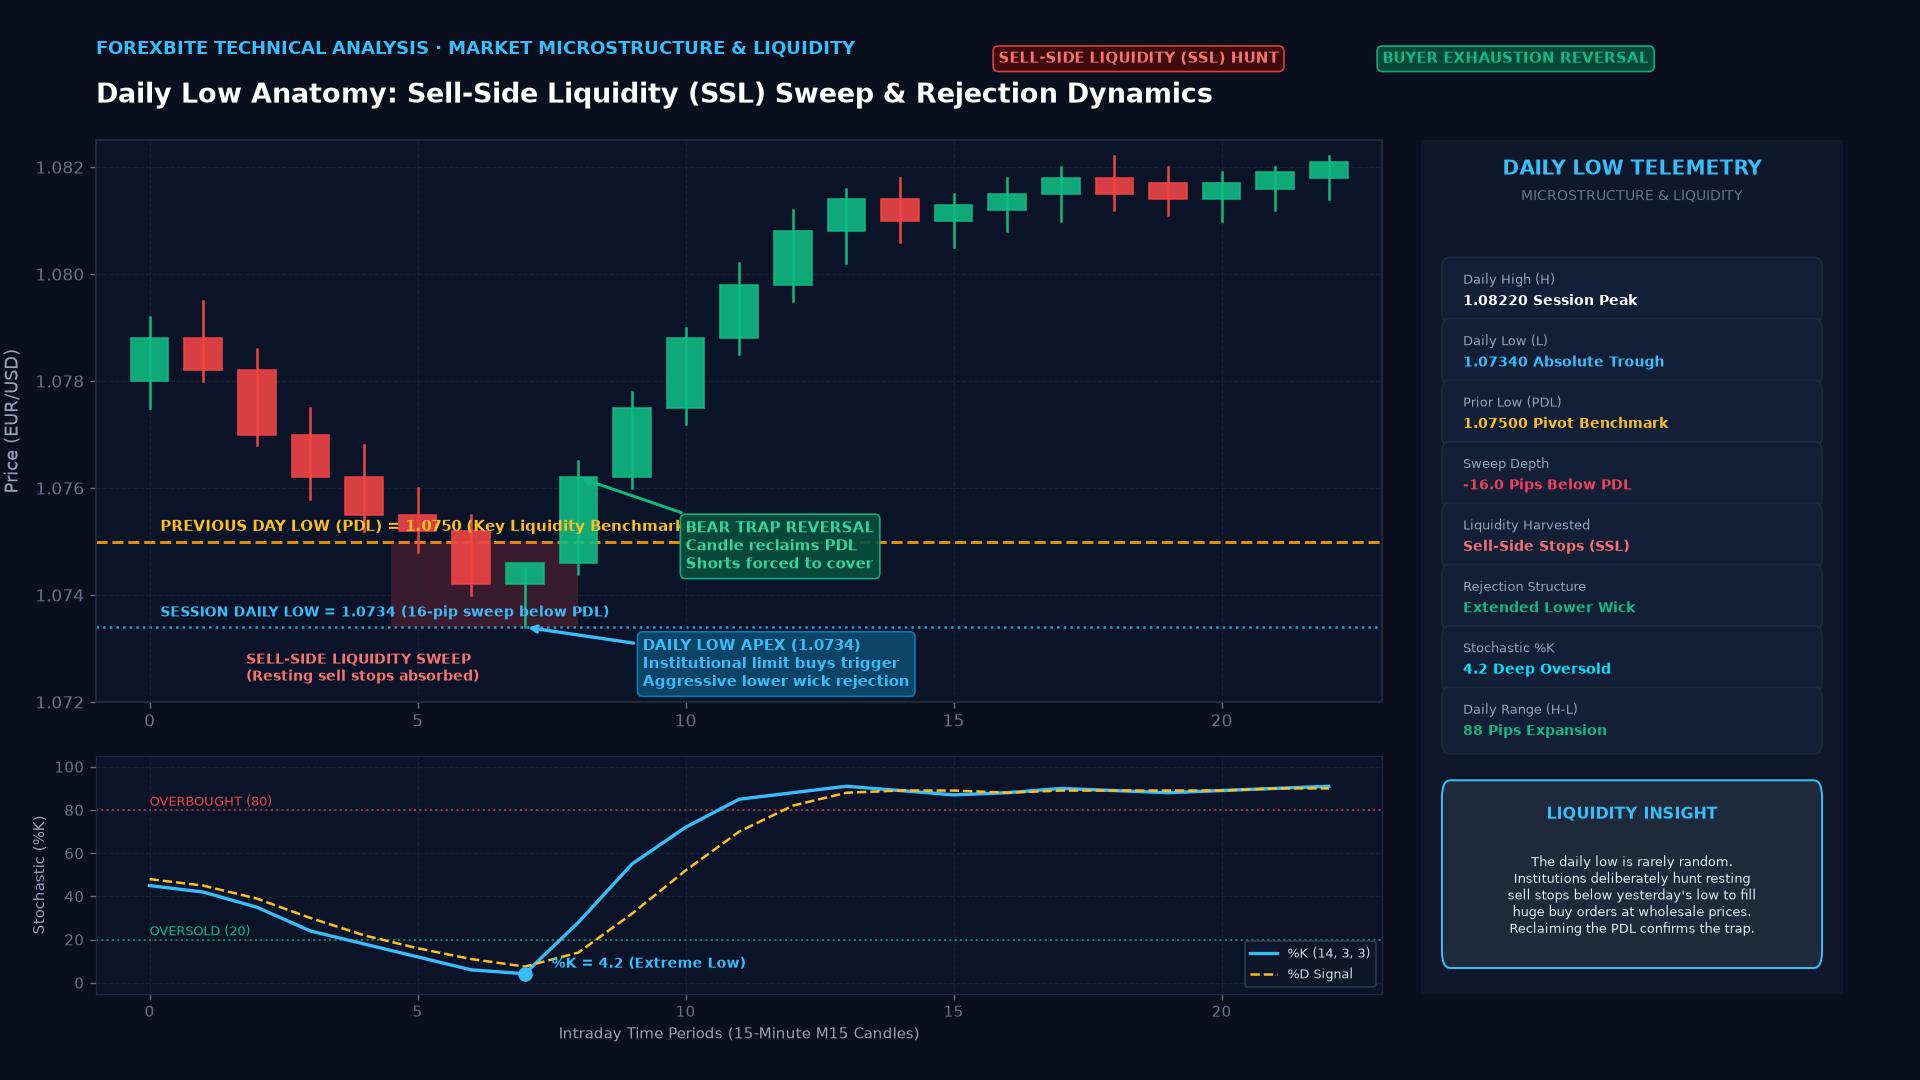
On a candlestick chart, the daily low is visually demarcated by the tip of the lower shadow (wick). In market microstructure, the daily low is a critical structural boundary: it represents the deepest price level reached by aggressive sellers before buying liquidity emerged in sufficient volume to absorb the sell orders and reverse the downward trajectory.
Technical Mechanics & Quantitative Oscillator Formulation
The daily low is a core variable across quantitative technical models, oscillators, and pivot point calculations:
1. The Stochastic Oscillator (%K)
The Stochastic Oscillator evaluates where the current closing price ($C$) stands relative to the 14-period daily low ($L_{14}$) and high ($H_{14}$):
$$%K = \left( \frac{C - L_{14}}{H_{14} - L_{14}} \right) \times 100$$
When the price trades near the daily low, $%K$ approaches $0.0$, indicating deeply oversold market conditions.
2. Floor Trader Support Pivots
Classical floor trading models derive key support targets from the prior session’s high ($H$), low ($L$), and close ($C$):
$$\text{Pivot Point (PP)} = \frac{H + L + C}{3}$$
$$\text{Support 1 } (S_1) = 2 \cdot PP - H$$
$$\text{Support 2 } (S_2) = PP - (H - L)$$
3. Sell-Side Liquidity (SSL) Raids
In algorithmic order flow analysis, the Previous Day’s Low (PDL) serves as a major pool of sell-side liquidity (SSL). Retail long traders place stop-loss market orders directly beneath the daily low. When institutional desks seek to accumulate massive long positions without driving up spot prices, they intentionally push price below the previous daily low, triggering the cascade of sell-stop orders. The institutions buy directly into these automated sell orders, filling their bids before allowing price to rebound sharply.
Comparative Matrix: Low Price Tiers
| Low Price Tier | Measurement Window | Market Psychology | Trading Execution Strategy |
|---|---|---|---|
| Daily Low (PDL) | Single 24-Hour Session | Intraday capitulation or rejection | Stop-loss hunting / Mean-reversion scalping |
| Weekly Low (PWL) | 5 Consecutive Trading Days | Intermediate structural support | Swing trade invalidation level |
| 52-Week Low | Rolling 252 Trading Days | Extreme bearish pessimism | Value investing accumulation / short squeeze |
| All-Time Low (ATL) | Complete historical price history | Existential crisis / distressed asset | Distressed asset restructuring |
Real-World Case Study: The March 2020 COVID Capitulation Low
The ultimate macroeconomic demonstration of a structural daily low occurred on March 23, 2020, during the climax of the pandemic financial market panic.
Anatomy of a Historic Daily Low:
1. The Cascade: Over four weeks, the S&P 500 collapsed by 35% amid global economic lockdown announcements.
2. The Session (March 23, 2020):
   * S&P 500 futures opened limit-down overnight.
   * Cash index plunged to an intraday daily low of 2,191.86.
3. The Policy Catalyst: At 08:00 EST, the Federal Reserve announced unprecedented, open-ended Quantitative Easing ("QE Infinity"), committing to purchase unlimited US Treasuries and corporate bonds.
4. The Reversal Wick: Institutional capital flooded the market, buying billions of dollars in equities directly at the lows. The daily candle closed near its session highs, leaving an immense lower shadow.
5. The Legacy: The 2,191.86 level marked the absolute cycle low, launching the fastest bull market recovery in modern financial history.
Frequently Asked Questions (FAQ)
How do professional traders use the previous day’s low (PDL) for risk management?
Professional traders use the PDL as an objective technical invalidation level. When entering a long momentum position following a bullish daily confirmation candle, the trader places their stop-loss order slightly beneath the previous day’s low. If price breaks and closes below the PDL, the bullish thesis is invalidated, and the trade is automatically exited to preserve capital.
What is the difference between a “double bottom” and a daily low sweep?
A double bottom is a classical chart pattern where price tests a previous daily low, finds strong support, and bounces without breaching the level, confirming a solid support floor. A daily low sweep (or liquidity raid) occurs when price deliberately breaks slightly below the previous daily low to trigger stop orders and trap breakout short sellers, before immediately reversing and closing back above the level.
Why do daily lows on Monday often set the tone for the entire trading week?
In institutional foreign exchange and equity markets, the “Monday Low” frequently forms the absolute low of the entire week during a strong bullish weekly trend. Institutional algorithms often sweep liquidity below the Friday close or Monday open during the early Asian/London sessions to establish the weekly low (known as the “Judas Swing” in market microstructure), before driving the asset in its true directional trend for the remainder of the week.
Ready to trade forex?
Open a free demo account with a regulated broker. Practice with virtual funds before risking real money.