Daily High
The daily high is the highest market price achieved by a financial instrument during a 24-hour trading session, representing the peak boundary of buyer momentum and resistance before sellers intervened.
What Is the Daily High?
In financial market technical analysis, the daily high (abbreviated as H in OHLC bar data) represents the absolute peak transaction price recorded for a security, currency pair, commodity, or index throughout a single trading day.
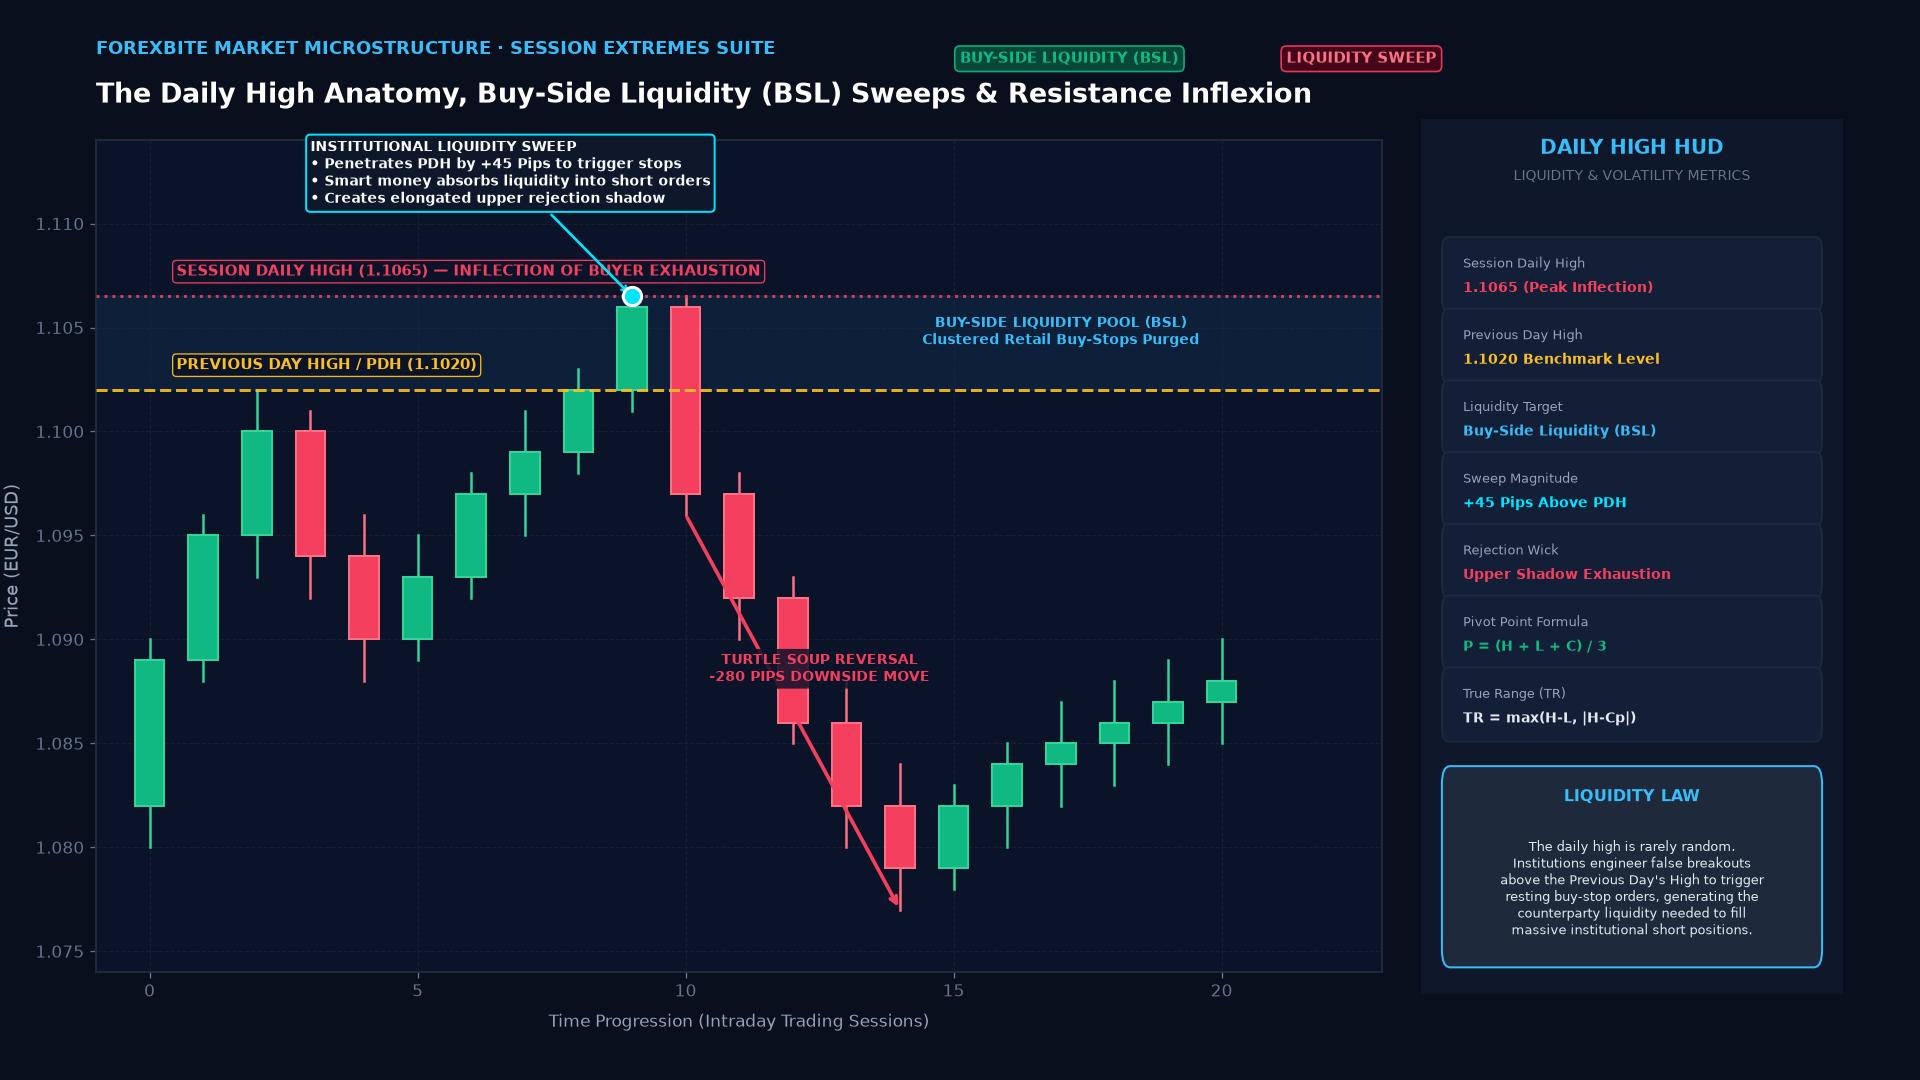
On a Japanese candlestick chart, the daily high forms the apex of the upper shadow (wick) of the daily candle. Rather than merely recording a historical price extreme, the daily high serves as a vital structural reference point for institutional algorithms and proprietary traders: it marks the exact inflection price where buyer exhaustion occurred, profit-taking materialized, and sellers overwhelmed market demand to push prices back down.
Technical Mechanics & Indicator Derivations
The daily high is a required input across standard quantitative volatility and trend indicators:
1. True Range (TR) & Average True Range (ATR)
In Welles Wilder’s volatility metrics, the True Range explicitly factors in gap risk relative to the prior session’s close ($C_{p}$):
$$TR = \max\left( H - L, |H - C_p|, |L - C_p| \right)$$
$$ATR_t = \frac{ATR_{t-1} \times (n - 1) + TR_t}{n}$$
2. Classical Floor Trader Pivot Points
Professional floor traders utilize the daily high ($H$), low ($L$), and close ($C$) to calculate daily support and resistance levels:
$$\text{Pivot Point (PP)} = \frac{H + L + C}{3}$$
$$\text{Resistance 1 } (R_1) = 2 \cdot PP - L$$
$$\text{Resistance 2 } (R_2) = PP + (H - L)$$
3. Buy-Side Liquidity (BSL) Sweeps
In modern smart money concepts (SMC) and market microstructure analysis, the Previous Day’s High (PDH) is an institutional liquidity magnet. Retail traders frequently place stop-loss orders for short positions just 1 to 5 pips above the PDH. Institutional market makers intentionally drive price above the daily high to trigger those buy-stop orders, consuming the liquidity to open large institutional short positions before reversing price lower.
Comparative Matrix: High Price Benchmark Tiers
| High Price Tier | Time Horizon | Structural Significance | Institutional Market Behavior |
|---|---|---|---|
| Daily High (PDH) | Single 24-Hour Session | Immediate intraday resistance | High-frequency liquidity stop-runs |
| Weekly High (PWH) | Monday through Friday | Major swing pivot level | Macro swing trading stop placement |
| 52-Week High | Rolling 252 Trading Days | Long-term momentum filter | Momentum factor funds buy breakouts |
| All-Time High (ATH) | Entire historical lifecycle | Zero historical overhead supply | Price discovery mode; options call skew |
Real-World Case Study: The London / New York Session Liquidity Sweep
In the spot foreign exchange market (specifically EUR/USD), the interplay between the Asian session daily high and the London session open is a primary setup for quantitative trading desks.
Anatomy of an Intraday Liquidity Raid:
1. The Asian Session: EUR/USD consolidates in an 18-pip range between 00:00 and 07:00 GMT, printing an Asian session high at 1.0850.
2. The Retail Positioning: Retail traders enter short breakout orders below or place stop-losses on short positions 3 pips above the Asian high at 1.0853.
3. The London Open (08:00 GMT): Institutional algorithmic desks inject aggressive buy volume, pushing EUR/USD up to 1.0858, piercing the daily high by 8 pips.
4. The Trap: The price spike triggers the clustered retail buy-stop orders. The institutional desks sell into this buying surge, absorbing the liquidity.
5. The Reversal: Within 15 minutes, EUR/USD plunges 60 pips down to 1.0790. The 1.0858 level remains the permanent Daily High for the entire 24-hour cycle.
Frequently Asked Questions (FAQ)
At what time does the daily high reset in the 24-hour foreign exchange market?
In global foreign exchange, the trading day officially resets at 17:00 New York time (5:00 PM EST), which coincides with the daily close of the US financial markets and the rollover swap calculation. Charting platforms conforming to international standards (New York 5:00 PM close charts) calculate the official daily high from 17:00 EST of one day to 17:00 EST of the next, producing exactly five daily candles per week and avoiding fractional weekend candles.
What is the difference between a “sweep” and a “breakout” of the daily high?
A breakout occurs when price moves above the previous daily high with sustained institutional volume and closes above that level on high-timeframe candles (such as the 1-hour or 4-hour chart), signaling trend continuation. A sweep (or turtle soup) occurs when price momentarily pierces the daily high by a few pips to trigger resting stop-loss liquidity, but immediately closes back below the level, printing a long upper rejection wick that signals an imminent reversal.
What does an “inside day” indicate regarding the daily high?
An inside day occurs when the entire trading range of the current session remains completely within the high and low boundaries of the preceding day ($H_{\text{today}} < H_{\text{prior}}$ and $L_{\text{today}} > L_{\text{prior}}$). This pattern signifies market consolidation, volatility contraction, and equilibrium between buyers and sellers, frequently preceding a violent directional volatility expansion once the daily high or low is eventually breached.
Ready to trade forex?
Open a free demo account with a regulated broker. Practice with virtual funds before risking real money.