V-Formation
A V-formation, or V-bottom (inverted as a V-top), is an abrupt technical chart reversal pattern characterized by an aggressive, steep price decline followed immediately by an equally rapid, high-momentum recovery without an intervening consolidation base.
What Is a V-Formation?
In technical analysis and market price action, a V-formation (commonly referred to as a V-bottom, spike reversal, or an inverted V-top) is a powerful reversal pattern that catches market participants off guard due to the absence of a transitional basing period. While classic technical reversal patterns (such as double bottoms or head-and-shoulders) build over weeks or months through gradual distribution and accumulation, a V-formation pivots instantly upon a single capitulation price point.
A V-bottom typically begins with an intense, panic-driven selloff fueled by cascading margin liquidations or unexpected geopolitical shocks. At the terminal apex, institutional buyers aggressively absorb distressed selling, triggering an immediate and violent short squeeze that drives prices back to pre-drop levels with velocity matching the initial descent.
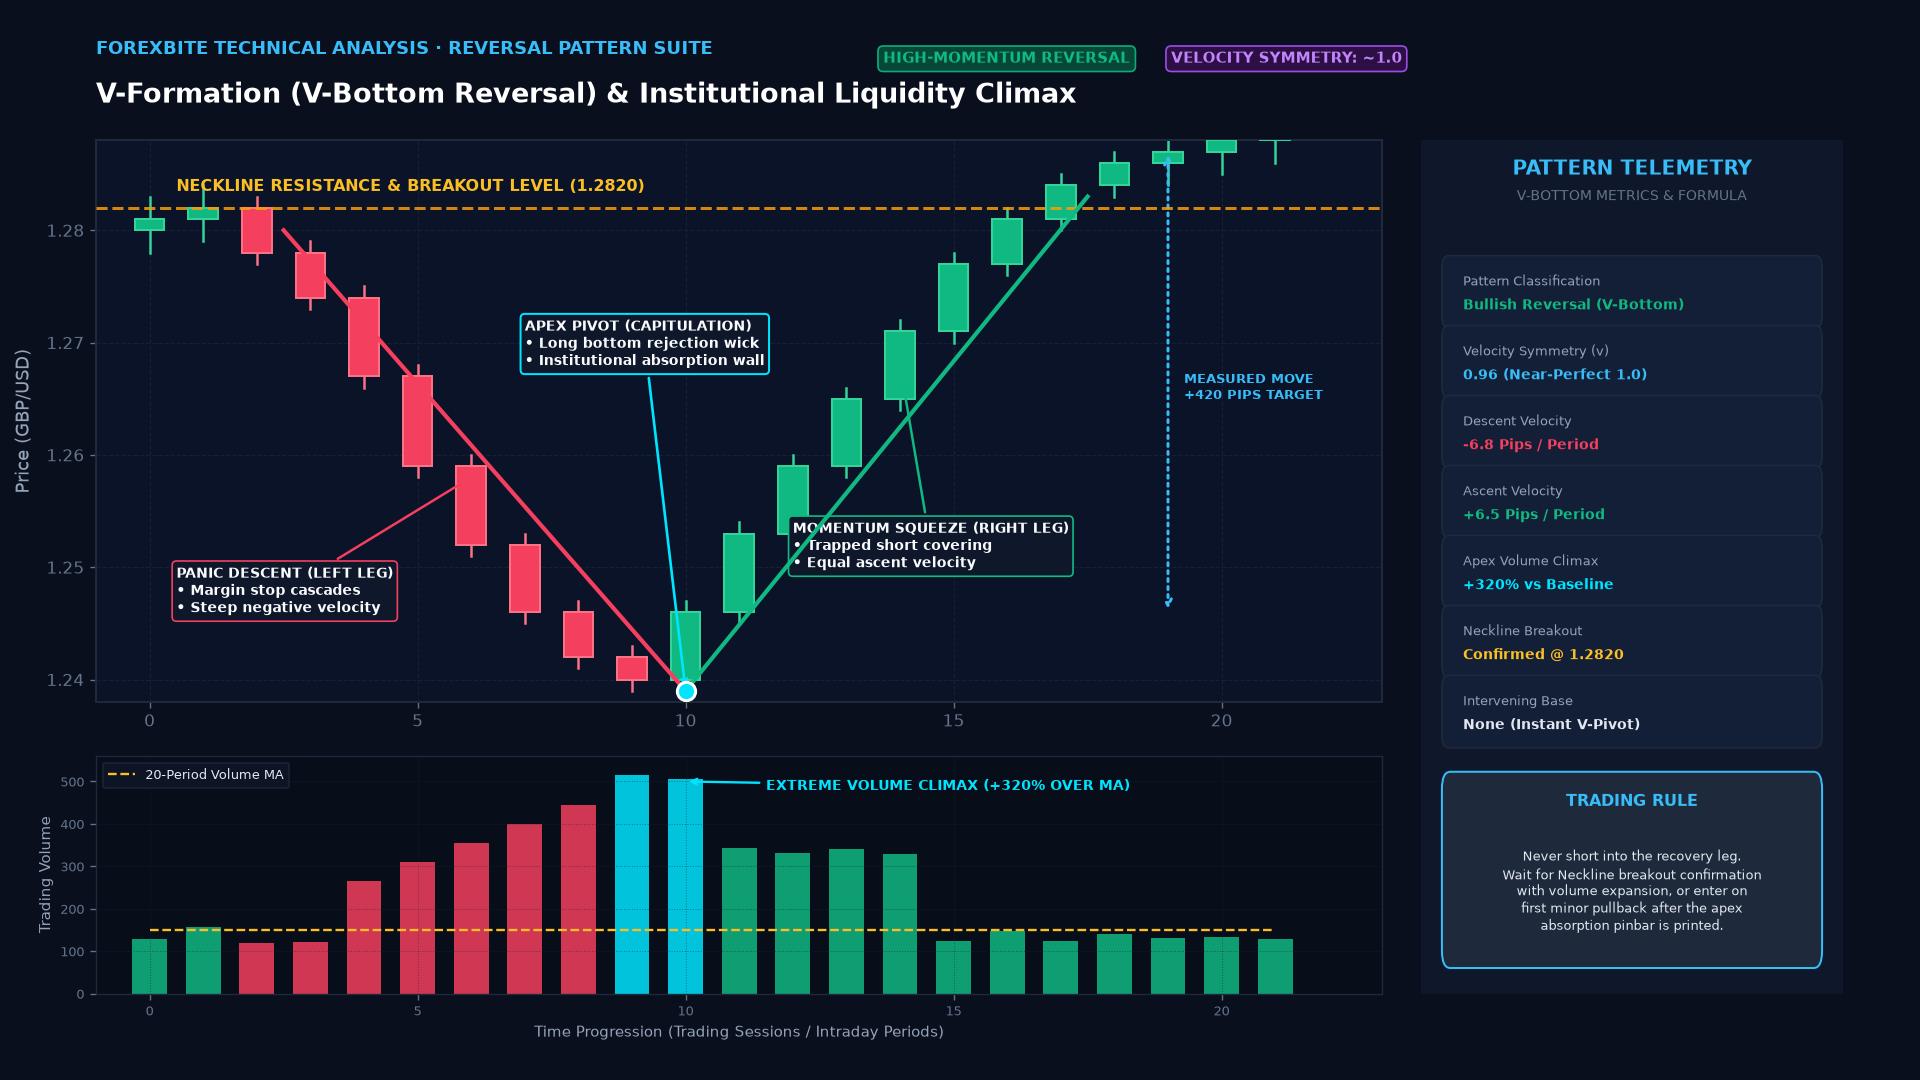 Figure: V-Formation (V-Bottom) price structure illustrating panic descent, apex absorption pinbar, volume climax, momentum squeeze, and neckline breakout confirmation.
Pattern Geometry & Mathematical Velocity
Technical analysts measure the structural validity of a V-formation by evaluating directional velocity ($v$) and volume exhaustion ratios:
1. Velocity Symmetry Ratio
In a textbook V-formation, the velocity of the recovery ascent ($v_{\text{ascent}}$) closely mirrors the velocity of the initial descent ($v_{\text{descent}}$):
$$v_{\text{descent}} = \frac{P_{\text{peak}} - P_{\text{trough}}}{\Delta t_{\text{descent}}}, \quad v_{\text{ascent}} = \frac{P_{\text{recovery}} - P_{\text{trough}}}{\Delta t_{\text{ascent}}}$$
$$\text{Velocity Symmetry Ratio} = \frac{v_{\text{ascent}}}{v_{\text{descent}}} \approx 1.00 \pm 0.25$$
If $v_{\text{ascent}} \ll v_{\text{descent}}$, the rebound is classified as a weak bear-market rally or “dead-cat bounce” rather than a genuine V-formation, signaling probable retesting of the lows.
2. Volume Climax Confirmation
The terminal turning point (apex) must display an exponential volume surge, indicating institutional liquidity absorption:
$$\text{Volume Surge Ratio} = \frac{V_{\text{apex}}}{\text{SMA}_{20}(V)} \ge 2.50$$
Where $V_{\text{apex}}$ represents the transaction volume executed on the apex candlestick, and $\text{SMA}_{20}(V)$ is the 20-period moving average of volume.
Reversal Chart Patterns Compared
| Pattern Type | Basing Duration | Apex Structure | Retest Required? | Trading Difficulty |
|---|---|---|---|---|
| V-Formation (Spike) | Instantaneous (1 to 3 candles) | Sharp single-point pivot; exhaustion tail | No; moves immediately away from low | Extremely High (risk of catching falling knives) |
| Double Bottom (“W”) | Moderate (Weeks to months) | Two distinct troughs separated by a neckline peak | Yes; tests prior low support | Moderate (clear invalidation levels) |
| Head and Shoulders | Prolonged (Months) | Three successive peaks/troughs with sloping neckline | Yes; neckline retest common | Low to Moderate (established rulebook) |
| Rounded Bottom (Saucer) | Extended (Quarters to years) | Gradual parabolic curve; low turnover base | No; smooth momentum shift | Low (trend-following confirmation) |
Microstructure: What Causes a V-Formation?
A V-bottom is rarely an accident; it is the physical manifestation of order book exhaustion followed by asymmetric liquidity:
- Liquidity Black Hole: In the final stages of the descent, resting limit buy orders are wiped out. Market sell orders slip downward through empty price levels.
- The Institutional Bid: Large institutional value funds and quantitative algorithms identify extreme structural undervaluation (or central bank emergency intervention announcements occur) and step in with massive iceberged limit buy orders.
- The Panic Buyback (Short Squeeze): Momentum traders who shorted near the bottom realize they are trapped. As they rush to cover by buying at market, they compete with aggressive dip-buyers, triggering a vertical price ascent into an empty offer book.
Real-World Institutional Case Study: The March 2020 COVID-19 V-Bottom
The most historic modern example of a macro V-formation unfolded across global markets in February–April 2020 during the onset of the COVID-19 pandemic.
Between February 19 and March 23, 2020, the S&P 500 plunged $34%$ in just 22 trading sessions—the fastest bear market descent in Wall Street history. Safe-haven currencies surged, credit spreads exploded, and crude oil futures plummeted.
[February 19 - March 23, 2020: The Left Leg]
S&P 500 drops 3,393 -> 2,191 (Descent Velocity: -54.6 points/day)
Cboe VIX spikes to 85.47 (highest since 2008)
                    |
                    v
[March 23, 2020: The Apex Pivot]
Federal Reserve announces open-ended Quantitative Easing (QE)
and corporate credit facilities (Primary & Secondary Market Corporate Credit Facilities)
Volume climax printed across NYSE and CME futures
                    |
                    v
[March 24 - June 8, 2020: The Right Leg]
S&P 500 surges 2,191 -> 3,232 (Ascent Velocity: +19.6 points/day)
100% Retracement of the entire pandemic panic within months
Traders who waited for a classic “double-bottom retest” were left completely on the sidelines as the market mounted a textbook V-shaped recovery, powered by trillions of dollars in emergency central bank liquidity and fiscal stimulus.
Frequently Asked Questions
Why is trading a V-formation considered dangerous for discretionary traders?
Because a V-formation lacks a consolidation base, attempting to buy during the descent entails “catching a falling knife”—entering before selling momentum has genuinely subsided. Traders who guess the bottom prematurely often face catastrophic drawdowns if the market accelerates downward into further margin liquidations.
How can a trader safely enter a V-formation?
Professional traders avoid trying to pinpoint the exact apex. Instead, they wait for confirmation on the right leg:
- The Break of Market Structure (BMS): Waiting for the price to break above the most recent lower high on the hourly or daily timeframe.
- The First Pullback Entry: Buying the first small consolidation or flag pattern formed after the initial explosive impulse wave off the lows.
What is an inverted V-formation (V-Top)?
An inverted V-formation (or V-top) is the mirror image of a V-bottom, occurring at market peaks. It features a parabolic, euphoric rally driven by retail FOMO (fear of missing out) that terminates in a sudden buying climax, immediately followed by an aggressive, vertical downward collapse.
Ready to trade forex?
Open a free demo account with a regulated broker. Practice with virtual funds before risking real money.