Uptick
An uptick, or plus tick, denotes a transaction in a financial asset executed at a price higher than the immediately preceding transaction, serving as the foundational quantum for measuring order-flow momentum and directional tick indexes.
What Is an Uptick?
In financial market microstructure and electronic exchange trading, an uptick (commonly designated as a plus tick and symbolized as +) describes a transaction executed at a price strictly higher than the price of the transaction immediately preceding it. If a stock trades at $$150.00$ and the very next execution occurs at $$150.01$, that subsequent transaction is an uptick.
The concept of the tick represents the atomic unit of price motion in financial time-series analysis. Ticks are continuously parsed by high-frequency trading (HFT) algorithms, market makers, and statistical arbitrage desks to classify order flow as buyer-initiated or seller-initiated, determine instantaneous market sentiment, and comply with statutory short-sale execution rules.
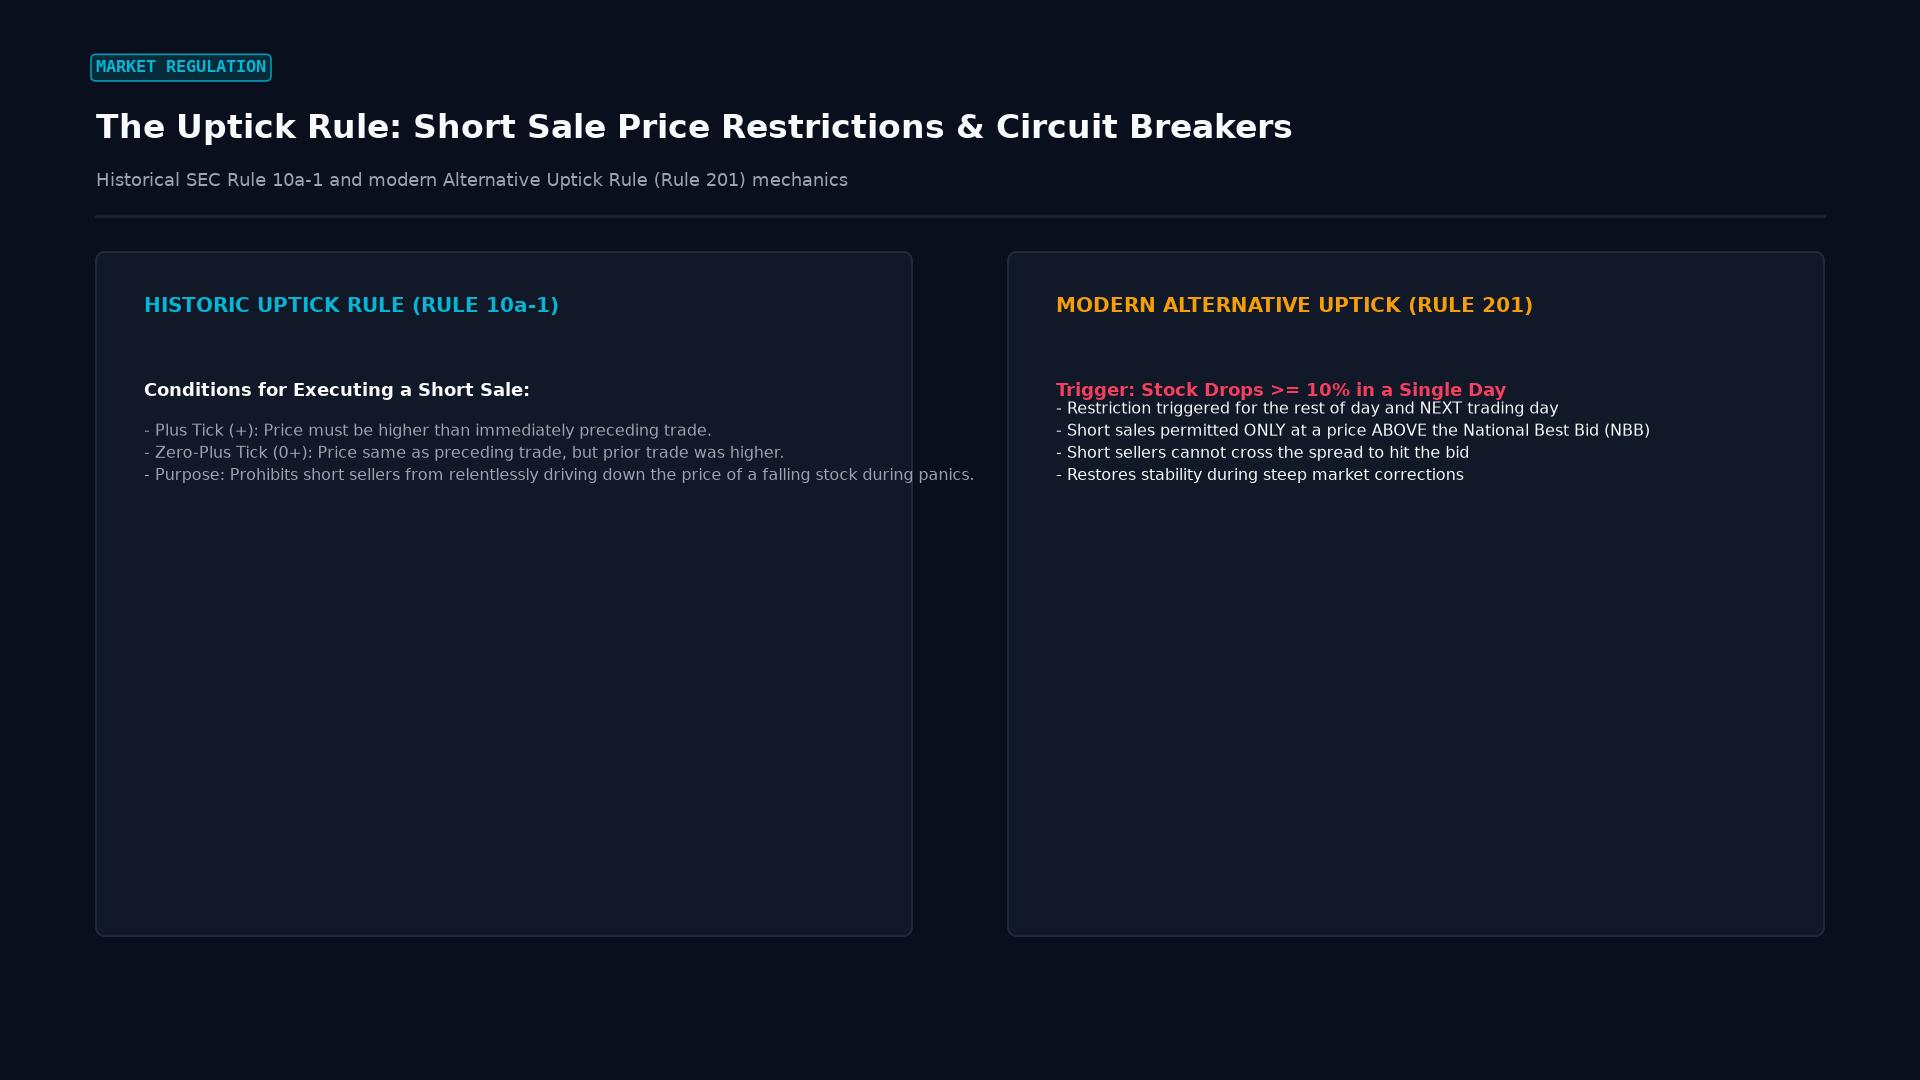 Figure: Regulatory short-selling restrictions: historical SEC Rule 10a-1 tick requirements and modern Rule 201 circuit breaker protections.
Mathematical Formulation & Tick Classifications
Tick sequences are classified into four discrete states based on directional sign and price memory:
1. The Tick Direction Function
Let $P_t$ represent the transaction price at sequential execution index $t$:
$$\text{Tick}t = \begin{cases} +1 & \text{if } P_t > P{t-1} \quad (\text{Uptick}) \ \text{Tick}{t-1} & \text{if } P_t = P{t-1} \quad (\text{Zero-Uptick if } \text{Tick}{t-1} = +1; \text{ Zero-Downtick if } -1) \ -1 & \text{if } P_t < P{t-1} \quad (\text{Downtick}) \end{cases}$$
2. The Lee-Ready Trade Classification Algorithm
In institutional empirical finance, Charles Lee and Mark Ready (1991) formulated the definitive methodology for determining whether a historical print was initiated by a buyer (lifting the offer) or a seller (hitting the bid):
$$D_t = \begin{cases} +1 & \text{if } P_t > M_t \quad (\text{Quote Rule: Above Midpoint } \implies \text{Buy}) \ -1 & \text{if } P_t < M_t \quad (\text{Quote Rule: Below Midpoint } \implies \text{Sell}) \ \text{Tick}_t & \text{if } P_t = M_t \quad (\text{Tick Rule: Falling back on last Uptick/Downtick}) \end{cases}$$
Where $M_t = \frac{\text{Bid}_t + \text{Ask}_t}{2}$ is the prevailing National Best Bid and Offer (NBBO) midpoint.
3. The Broad Market TICK Indicator ($TICK$)
Brokers and proprietary trading desks monitor aggregate market internal pressure using the NYSE TICK index:
$$$TICK = N_{\text{uptick}} - N_{\text{downtick}}$$
Where $N_{\text{uptick}}$ is the number of New York Stock Exchange constituent stocks currently trading on an uptick, and $N_{\text{downtick}}$ is the number on a downtick. Extreme readings ($$TICK > +1,000$ or $$TICK < -1,000$) signal exhaustion points or aggressive institutional program buying/selling.
Tick Taxonomy Across Trading Environments
| Tick State | Definition | Example Sequence | Market Flow Implication |
|---|---|---|---|
| Uptick (+) | Price strictly higher than prior trade. | $$50.00 \to $50.05$ | Aggressive market buy order lifts resting limit ask. |
| Zero-Uptick (0+) | Price identical to prior trade, preceded by an uptick. | $$50.00 \to $50.05 \to $50.05$ | Persistent buyer demand exhausting limit order depth at the same price. |
| Downtick (-) | Price strictly lower than prior trade. | $$50.05 \to $50.01$ | Aggressive market sell order hits resting limit bid. |
| Zero-Downtick (0-) | Price identical to prior trade, preceded by a downtick. | $$50.05 \to $50.01 \to $50.01$ | Sustained selling pressure absorbing limit orders at the lower price tier. |
Regulatory Applications: Short Sale Circuit Breakers
The concept of the uptick forms the historical bedrock of equity and derivatives regulation. For over seventy years, the US Securities and Exchange Commission (SEC) enforced the original Uptick Rule (Rule 10a-1), barring short sales from being executed except on an uptick or zero-uptick.
Under the modernized Alternative Uptick Rule (SEC Rule 201), if a stock plunges $10%$ or more in a single trading session, an automated circuit breaker activates: short selling is prohibited for the remainder of the day and the entire following trading session unless the short sale is placed at a price strictly above the current national best bid (a passive uptick order).
Stock Plunges >= 10% in a Single Day
                 |
                 v  (Rule 201 Activated)
SHORT-SELLING BANNED AT OR BELOW THE NATIONAL BEST BID
                 |
                 v
Short sellers CANNOT hit the bid (no aggressive selling into falling market)
Short sellers MUST rest limit orders on the offer (must wait for buyers to step in)
Result: Halts bear-raid downward liquidity spirals
Real-World Institutional Case Study: The May 2010 Flash Crash & The $TICK Collapse
On the afternoon of May 6, 2010, the US equity market suffered one of the most violent crashes in financial history, with the Dow Jones Industrial Average plummeting nearly 1,000 points in roughly 36 minutes before rebounding.
During the height of the dislocation (14:42–14:47 EDT), an algorithmic mutual fund executed a massive automated sell program of 75,000 E-mini S&P 500 futures contracts ($\approx $4.1\text{ billion}$) using an aggressive volume-execution algorithm without price limits.
[May 6, 2010: The Cascade of Continuous Downticks]
Sell Algorithm dumps 75,000 E-mini contracts into thin order book
                    |
                    v
High-Frequency Market Makers' risk models hit inventory limits -> HFTs shut down quoting
                    |
                    v
Bid-side order book depth completely evaporates:
Thousands of US stocks trade exclusively on DOWNTICKS for consecutive minutes
                    |
                    v
The NYSE TICK Indicator plunged to an unprecedented -1,400 to -1,800
                    |
                    v
Exotic shares (Procter & Gamble, Accenture) experienced momentary executions at $0.01
By analyzing sub-millisecond tick feeds after the crash, regulatory investigators discovered that several large automated equity market makers had designed their algorithms to halt trading whenever the ratio of downticks to upticks exceeded $80%$ over a rolling 5-second window. The withdrawal of these automated market makers created an algorithmic liquidity vacuum, proving that the microscopic distribution of upticks and downticks governs macro market stability.
Frequently Asked Questions
What causes an uptick in foreign exchange markets?
In foreign exchange ECNs (such as EBS or Currenex), an uptick occurs when an aggressive market participant submits a market buy order large enough to exhaust all available liquidity sitting at the top of the limit order book, forcing the next transaction to match with a sell order at a higher price tier.
Is an uptick identical to a pip?
No. An uptick describes the directional property of a price change (i.e., that the price moved up relative to the prior trade). A pip is a unit of measurement quantifying the minimum price change standard (typically $0.0001$ in G10 FX). An uptick can be equal to a fraction of a pip (such as a $0.1$ pipette movement) or several pips during volatile price gaps.
How does the NYSE TICK differ from the Advance-Decline line?
The Advance-Decline line measures whether stocks are currently trading higher or lower compared to their prior day’s official closing price (a macro daily timeframe). The NYSE TICK measures whether stocks are trading higher or lower compared to their immediately preceding trade (a sub-second intraday microstructure metric).
Ready to trade forex?
Open a free demo account with a regulated broker. Practice with virtual funds before risking real money.