Fakeout
A fakeout is a false breakout where the price of an asset momentarily moves past a recognized technical support or resistance level, triggering stop orders and trapping breakout traders before swiftly reversing direction.
A fakeout, commonly known in financial market technical analysis as a false breakout, occurs when an asset’s market price penetrates a critical support, resistance, chart pattern, or key psychological barrier, only to reverse sharply and retreat back into the preceding trading range. This price action traps traders who entered momentum positions on the initial breach and triggers stop-loss orders from market participants holding defensive positions. In foreign exchange, equities, and derivatives markets, fakeouts are not random anomalies; they reflect structural liquidity dynamics, order book mechanics, and institutional execution algorithms that exploit predictable retail order clustering.
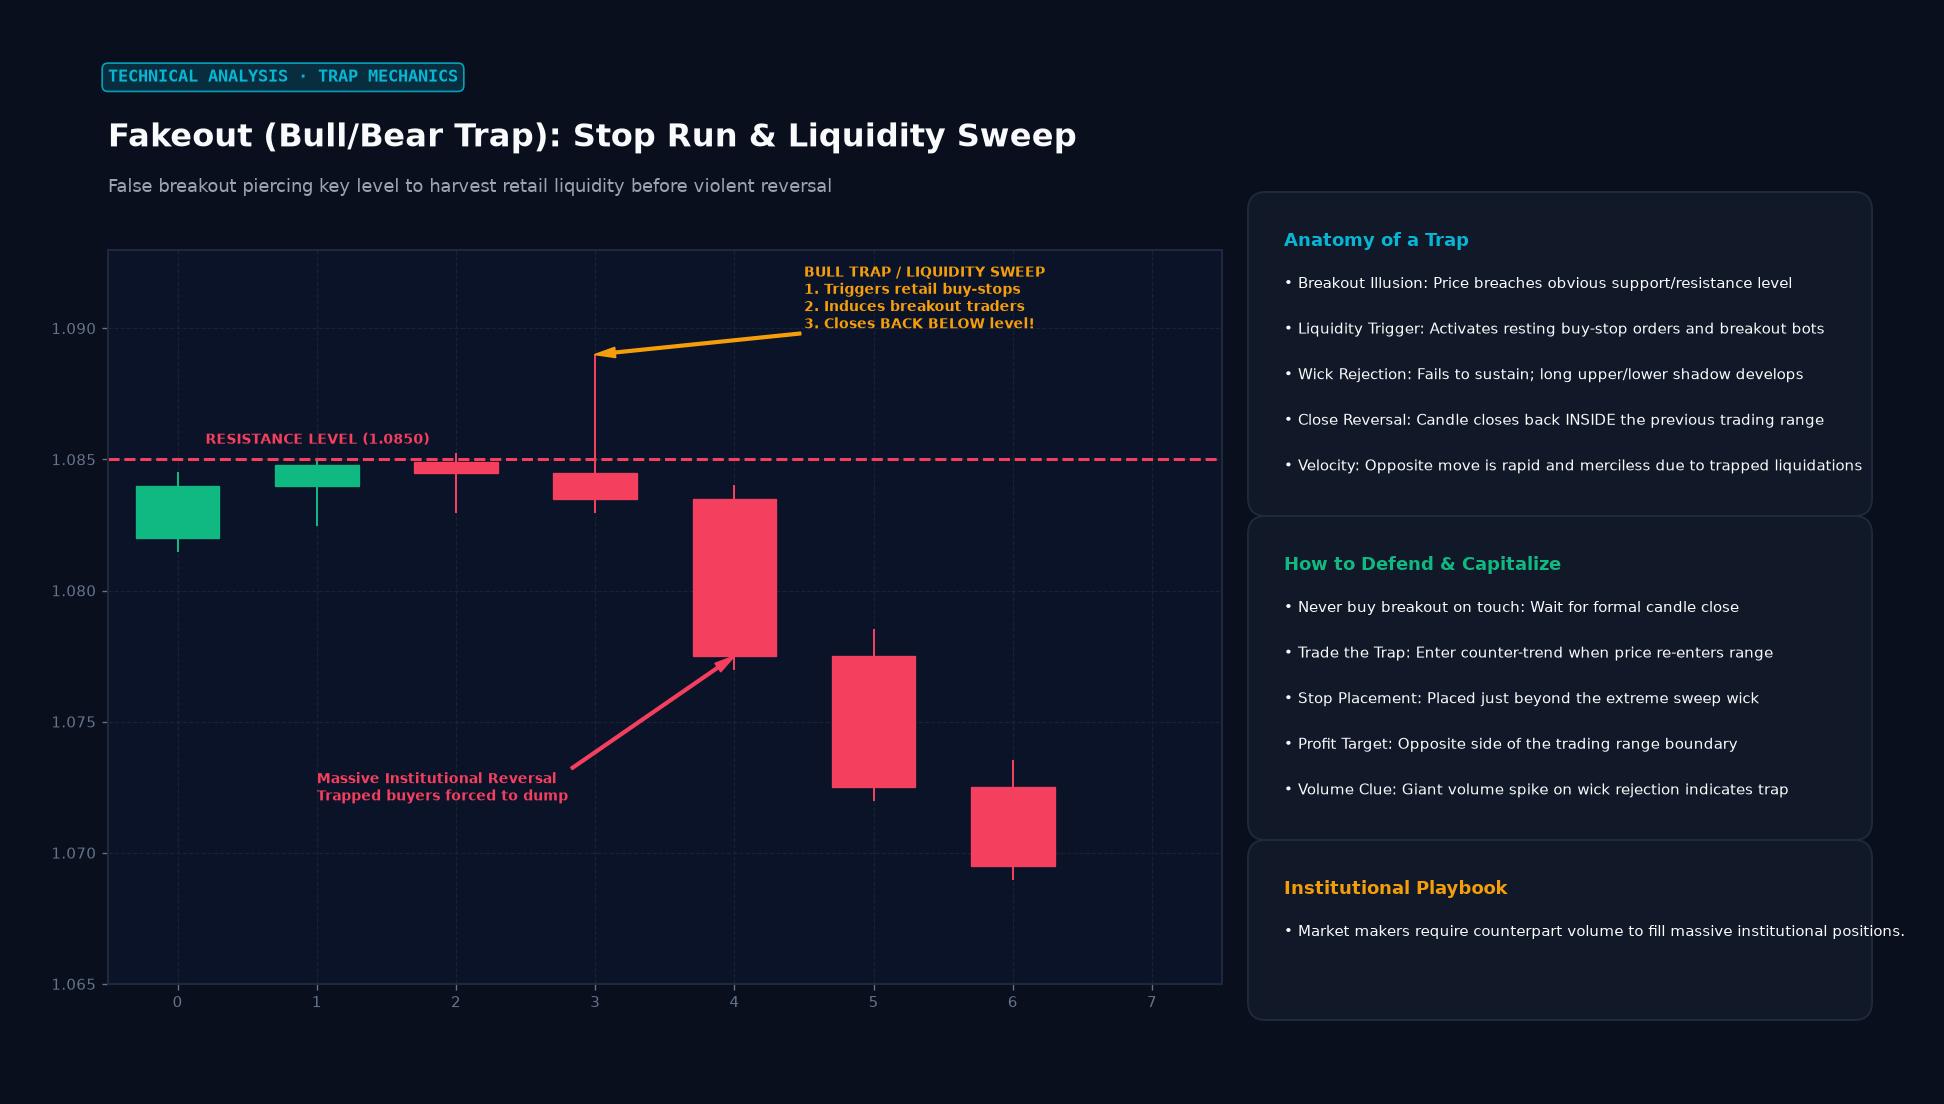 Figure: False breakout piercing key level to harvest retail liquidity before violent reversal
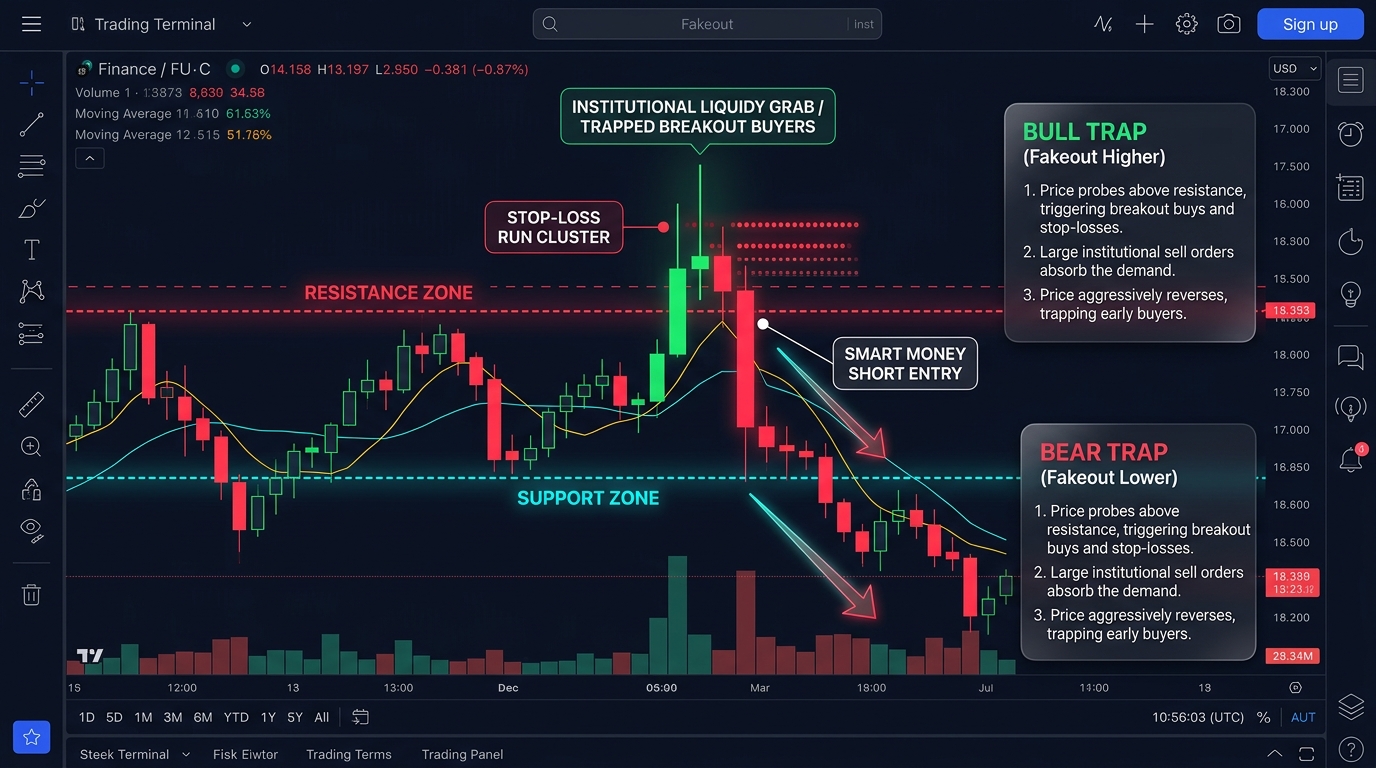
Microstructure and the Mechanics of Liquidity Hunting
To understand why fakeouts occur with high frequency near obvious technical levels, one must examine the mechanics of the central limit order book (CLOB) and the liquidity requirements of institutional market participants.
Large institutional players, including macro hedge funds, central bank reserve managers, and sovereign wealth funds, trade in substantial notionals ($50 million to $500 million per block). If an institutional trading desk attempts to execute a market buy order of that magnitude within a tight, consolidated range, the transaction would cause massive upward slippage, ruining their average entry price.
To fill large orders efficiently, institutional algorithms search for concentrated pools of opposing resting orders. Technical analysis conventions dictate that thousands of retail and algorithmic breakout traders place identical orders just outside range boundaries:
- Resting Stop-Loss Orders: Traders shorting at resistance place buy-stop orders just above the resistance line.
- Breakout Entry Orders: Momentum traders place buy-stop entry orders just above resistance to capture anticipated upward expansion.
Both order types represent buy-stop market orders. When price is deliberately pushed slightly above resistance, these buy stops are triggered simultaneously, creating a dense surge of buy-side market liquidity. Institutional market makers and algorithms exploit this liquidity window to sell (or short) vast inventory directly into the eager buyers. Once the institutional block is filled, buy-side liquidity evaporates, leaving the market top-heavy. Prices collapse back into the range, leaving breakout buyers trapped at the exact high of the move.
$$\text{Liquidity Absorption Point} = \text{Resistance Level} + \text{Resting Stop Cluster Spread}$$
Classic Formations: The Wyckoff Spring and Upthrust
The structural mechanics of the fakeout were first codified by legendary market technician Richard Wyckoff in the early twentieth century. Wyckoff categorized these false breakouts into two primary price action signatures:
1. The Wyckoff Upthrust (UT / UTAD)
An upthrust occurs during a distribution phase near the ceiling of an established range. Smart money drives the asset price to a new local high above resistance to test the strength of remaining buyers. When the breakout fails to attract sustained institutional volume, prices drop back into the trading range, confirming that distribution is complete and a markdown cycle is underway.
2. The Wyckoff Spring
A spring occurs at the base of an accumulation range. Price drops sharply below recognized support, inducing panic selling from retail holders and executing protective stop-losses. Institutional operators absorb this supply at wholesale prices. If the breakdown fails to generate continued selling pressure, the market swiftly snaps back above support, setting the stage for an explosive upward markup.
| Characteristic | True Breakout | False Breakout (Fakeout) |
|---|---|---|
| Volume Profile | Massive expansion on breakout candle and follow-through | Low volume on breach, or massive spike with narrow price progress |
| Candle Close | Closes decisively outside range on high timeframes | Leaves a long wick/shadow outside range, closes inside |
| Market Microstructure | Order book depth shifts upward, bid support follows | Liquidity evaporates instantly past the breakout barrier |
| Follow-Through | Consecutive bars advance in breakout direction | Immediate reversal candle (bearish engulfing / pin bar) |
| Time Spent Outside | Sustains multiple hourly or daily bars beyond the level | Fails within 1 to 3 price bars |
Identifying False Breakouts: Technical Filters
Professional currency traders use multiple quantitative and behavioral filters to separate genuine trend continuations from deceptive fakeouts:
1. The Time-Delay and Candle-Close Filter
A common mistake among retail traders is executing market orders the split second a price ticks beyond a support or resistance line. Institutional algorithms regularly push prices past a level during illiquid market transitions (such as the 17:00 New York rollover) to trigger stops. Applying a candle-close filter on higher timeframes (such as the 4-Hour or Daily chart) ensures that traders only acknowledge a breakout if the bar closes firmly beyond the boundary.
2. Volume Spread Analysis (VSA)
Volume provides the ultimate truth behind price movement. In a genuine breakout, price expansion is accompanied by rising volume and wide price spreads. In a fakeout:
- The breakout occurs on below-average volume, indicating lack of institutional participation.
- An ultra-high volume spike produces an extremely narrow range or a long upper wick (churning), indicating that professional money is dumping inventory into breakout buyers.
3. Bollinger Band Squeeze and Head Fakes
John Bollinger documented the “head fake” phenomenon in range-bound markets. When Bollinger Bands contract into a tight squeeze (indicating historically low volatility), the market often makes an initial deceptive feint in one direction, touching or piercing the outer band, before reversing violently into the true, sustained trend in the opposite direction.
Strategic Trading Approaches: Fading the Fakeout
Rather than falling victim to fakeouts, seasoned traders actively hunt and trade them. The strategy of taking a position counter to a failed breakout is known as “fading.”
                 EXECUTION PROTOCOL FOR FADING A FAKEOUT
                 =======================================

     Step 1: Identify key Multi-Touch Resistance Level
     Step 2: Monitor Price Penetration into Liquidity Pool
     Step 3: Await Exhaustion Wick or Strong Rejection Candle
     Step 4: Execute SHORT as Price Closes Back Inside Range
     Step 5: Place Protective Stop Above the Fakeout Wick Extreme
     Step 6: Target Opposing Boundary (Range Support) for Take-Profit
This strategy offers superior risk-reward profiles:
- Tight Stop-Loss: The invalidation point is clear and close, positioned just beyond the absolute high (or low) of the fakeout wick.
- Extended Target: The target is the opposing side of the established trading range, providing favorable risk-to-reward ratios, frequently 1:3 to 1:5.
Frequently Asked Questions
Why do fakeouts happen so frequently during major economic news releases?
Economic news releases, such as the US Non-Farm Payrolls or central bank rate decisions, cause market liquidity to thin out as institutional market makers widen their spreads and pull resting limit orders. The sudden influx of market orders pushes prices through technical levels easily. Once the knee-jerk reaction subsides, algorithmically driven valuation models reassert fundamental pricing, triggering rapid mean reversion.
What is the difference between a bull trap and a bear trap?
A bull trap is a fakeout above a resistance level that lures buyers into long positions right before the market plunges downward. A bear trap is a fakeout below a support level that convinces sellers to short the asset right before the market rebounds violently upward.
How can traders use Average True Range (ATR) to avoid fakeout stop-outs?
Placing stop-loss orders exactly at obvious support or resistance lines makes them vulnerable to liquidity grabs. By calculating the 14-period Average True Range (ATR) and positioning stop-losses at a buffer distance of 1.0 to 1.5 times ATR beyond the structural level, traders allow the market room to absorb noise and liquidity probes without getting prematurely stopped out.
Ready to trade forex?
Open a free demo account with a regulated broker. Practice with virtual funds before risking real money.