GDP deflator
The GDP deflator is a comprehensive macroeconomic price index that measures the level of prices of all new, domestically produced, final goods and services in an economy relative to a base year.
The GDP deflator, formally designated by national statistical agencies as the Implicit Price Deflator for Gross Domestic Product, is a macroeconomic price index that tracks the aggregate rate of price inflation across all final goods and services produced within a domestic economy. Calculated by comparing an economy’s Nominal Gross Domestic Product (measured in current prices) to its Real Gross Domestic Product (measured in constant base-year prices), the deflator provides central bankers, sovereign debt analysts, and currency traders with the broadest measure of domestic inflationary pressure, free from the structural sampling biases inherent in consumer-specific price baskets.
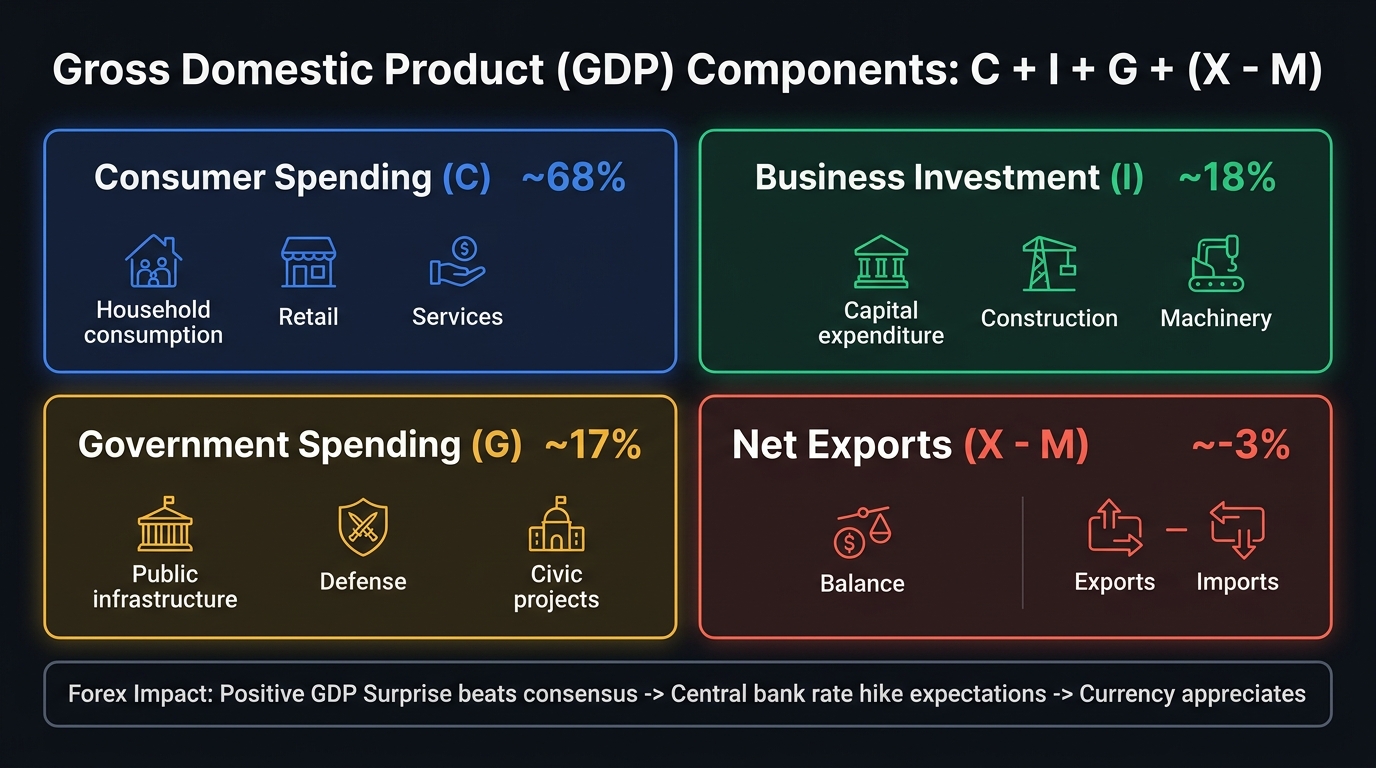
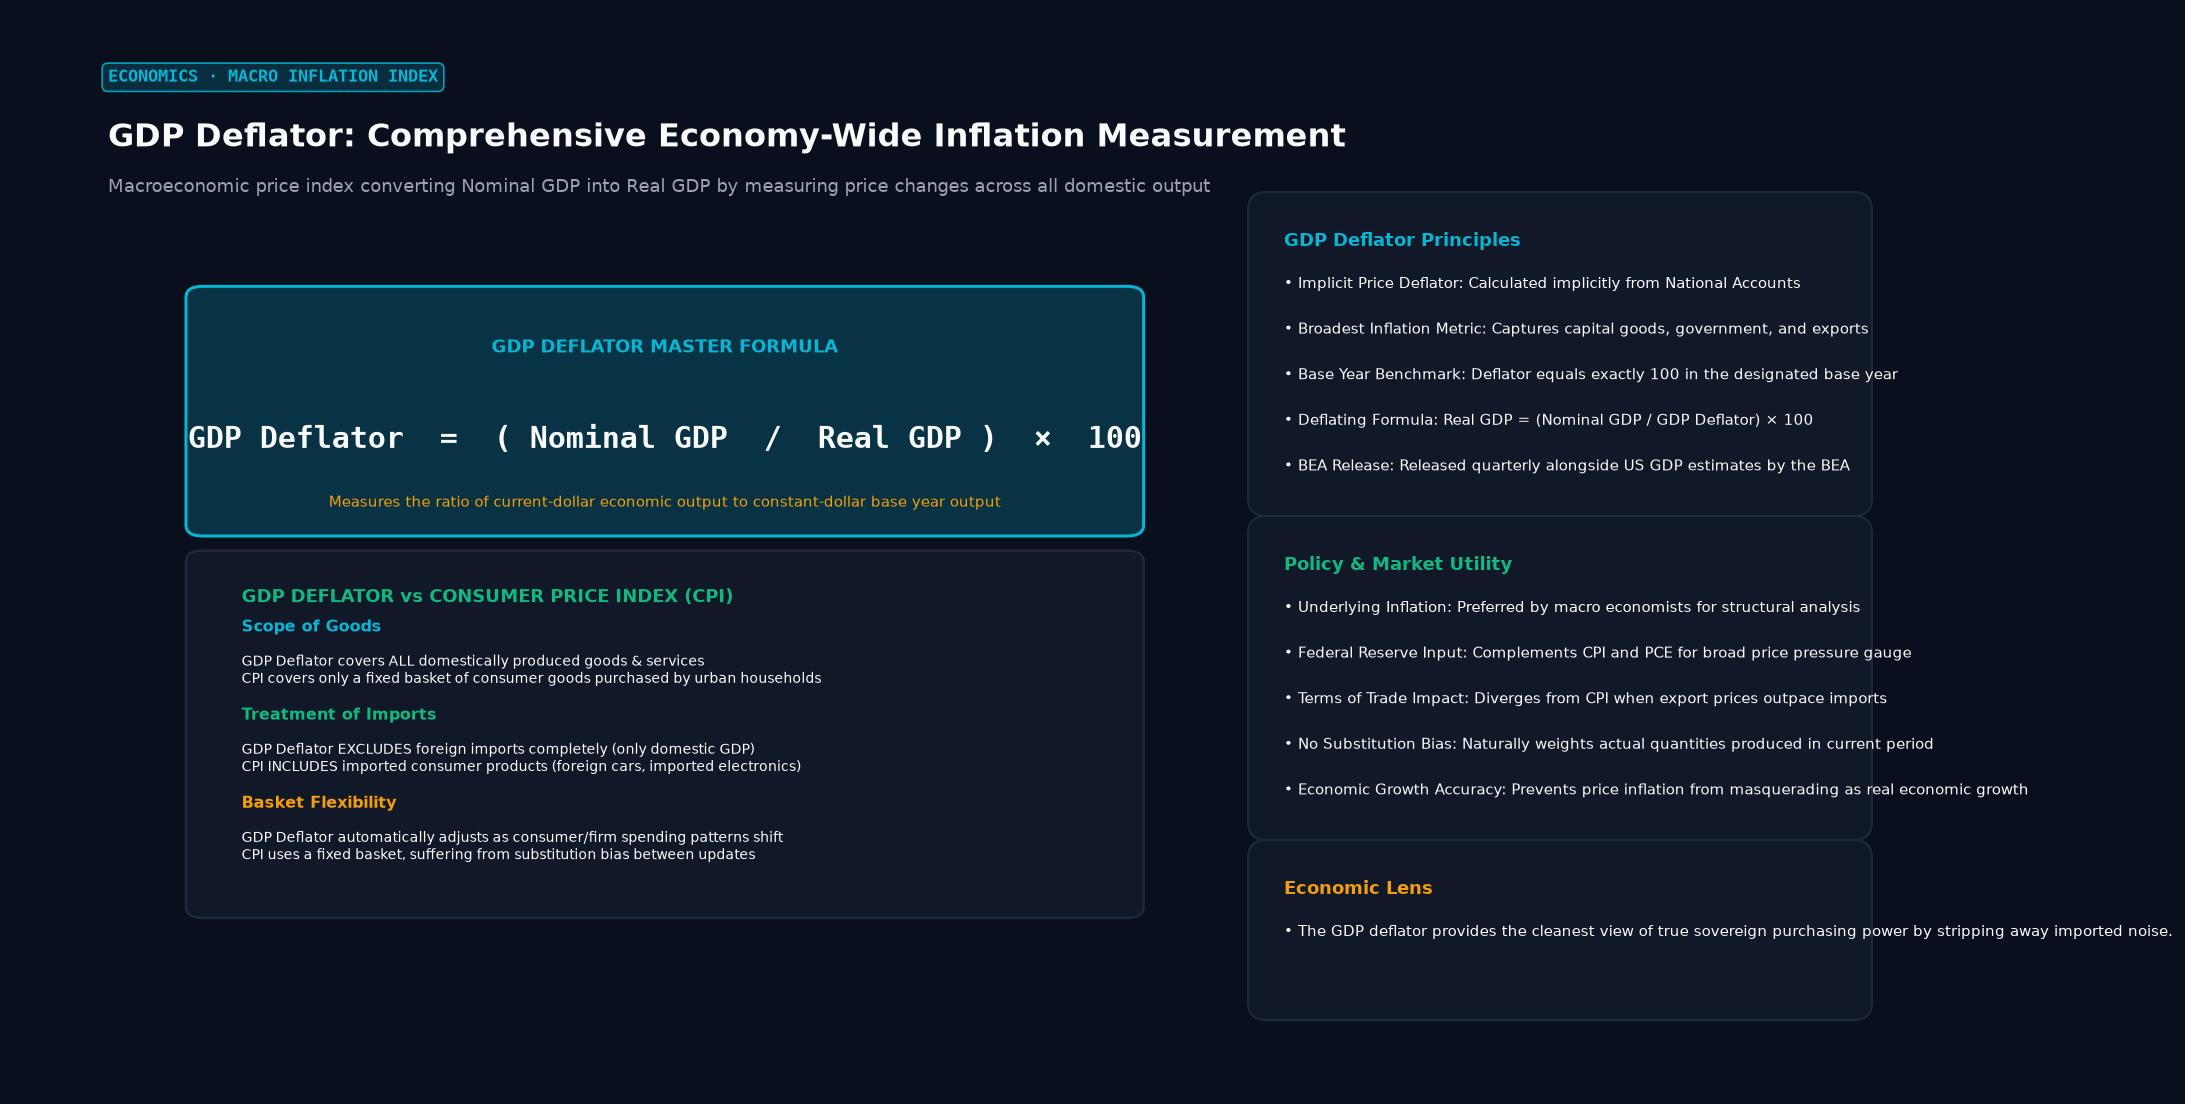 Figure: Macroeconomic price index converting Nominal GDP into Real GDP by measuring price changes across all domestic output
Mathematical Formula and Calculation Mechanics
The mathematical definition of the GDP deflator is the quotient of nominal economic output divided by real economic output:
$$\text{GDP Deflator} = \left( \frac{\text{Nominal GDP}}{\text{Real GDP}} \right) \times 100$$
To measure the annual rate of inflation between year $t-1$ and year $t$, economists compute the percentage change in the deflator:
$$\pi_t = \left( \frac{\text{GDP Deflator}t - \text{GDP Deflator}{t-1}}{\text{GDP Deflator}_{t-1}} \right) \times 100$$
In practice, modern national statistical agencies, such as the United States Bureau of Economic Analysis (BEA), do not use a simple fixed-base Laspeyres or Paasche formulation. Since 1996, the BEA has utilized a chained Fisher Ideal Index approach. This methodology dynamically links adjacent quarters, geometric-averaging quantity and price changes to prevent the rapid obsolescence of base-year weights caused by fast-falling prices in high-technology sectors such as semiconductors and consumer electronics.
GDP Deflator vs Consumer Price Index (CPI) vs PCE
Financial market analysts track three primary price measures: the GDP Deflator, the Consumer Price Index (CPI), and the Personal Consumption Expenditures (PCE) Price Index. While all three quantify inflation, their economic scopes, weighting systems, and market impacts diverge significantly.
       INFLATION MEASUREMENT COMPARISON MATRIX
       =======================================

   [ GDP DEFLATOR ]          [ CONSUMER PRICE INDEX (CPI) ]
   * All Domestic Output     * Urban Household Basket Only
   * Includes Capital Goods  * Excludes Capital Goods
   * Includes Defense/Gov    * Excludes Government Purchases
   * Excludes All Imports    * Includes Foreign Imports
   * Changing Output Weights * Fixed Survey Basket Weights
1. Scope of Goods and Services
- GDP Deflator: Covers everything produced domestically within national borders. It includes consumer goods, business equipment, factory construction, commercial software, fighter jets purchased by the military, and public infrastructure.
- Consumer Price Index: Measures solely the out-of-pocket goods and services purchased directly by urban consumers. It completely ignores industrial machine tools, commercial transport planes, and sovereign military expenditures.
2. Treatment of Foreign Imports
This represents the most critical operational divergence between the metrics:
- The GDP deflator reflects only domestic production. Because foreign imports are subtracted from headline GDP ($\text{GDP} = C + I + G + X - M$), imports are stripped out of the GDP deflator.
- The CPI measures the consumer shopping basket regardless of where goods are manufactured. If world crude oil prices surge, or imported Asian consumer electronics become expensive, the CPI rises immediately. By contrast, an import price surge does not directly inflate the GDP deflator, because imported energy is not domestic value added.
3. Basket Weighting: Flexible Output vs Fixed Basket
- CPI (Laspeyres Base): Relies on consumer expenditure surveys that fix basket weights for years. It suffers from substitution bias: if beef prices double, consumers substitute chicken, but a fixed CPI basket continues to weight expensive beef heavily, overstating true cost-of-living increases.
- GDP Deflator (Paasche / Chained): Automatically adjusts its weights to current production ($Q_t$). If consumers and businesses purchase fewer gas-guzzling vehicles and more efficient electric alternatives, the deflator’s weights shift automatically to reflect actual economic activity.
| Analytical Dimension | GDP Deflator | Consumer Price Index (CPI) | Personal Consumption Expenditures (PCE) |
|---|---|---|---|
| Publishing Agency | Bureau of Economic Analysis (BEA) | Bureau of Labor Statistics (BLS) | Bureau of Economic Analysis (BEA) |
| Frequency | Quarterly (with GDP revisions) | Monthly | Monthly |
| Underlying Formula | Chained Fisher Price Index | Modified Laspeyres Index | Chained Fisher Price Index |
| Import Inclusion | Excluded completely | Included heavily (fuels, apparel) | Included (consumer goods) |
| Capital Goods | Included (machinery, software) | Excluded completely | Excluded completely |
| Federal Reserve Preference | Background structural gauge | High headline public visibility | Official 2% target benchmark |
Forex and Macro Trading Implications
Currency desks, fixed-income traders, and sovereign asset managers monitor the GDP deflator for distinct strategic insights:
1. Assessing the Terms of Trade
The GDP deflator includes export prices while excluding import prices. Consequently, a sharp rise in the GDP deflator relative to the domestic consumer price index signals an improvement in a country’s Terms of Trade:
$$\text{Terms of Trade} = \frac{\text{Export Price Index}}{\text{Import Price Index}}$$
When a commodity-exporting nation (such as Australia, Canada, or Norway) experiences surging global demand for iron ore, crude oil, or natural gas, its export prices jump while domestic consumption prices remain relatively stable. The GDP deflator surges, reflecting robust sovereign revenue generation, which typically leads to appreciation in the domestic currency.
2. Decomposing Corporate Profit Margins
Equity and credit analysts compare the GDP deflator to unit labor cost growth. If the GDP deflator expands faster than average hourly earnings and unit labor costs, corporations are successfully expanding their profit margins by passing cost increases on to customers and enterprise buyers. Conversely, if wage costs rise while the GDP deflator lags, corporate profit margins face structural compression.
3. Real Sovereign Yield Curves
Bond portfolio managers calculate the real return on sovereign bonds by deflating nominal yields. While headline CPI is used for Treasury Inflation-Protected Securities (TIPS), macro economists use the GDP deflator to calculate the real economic growth rate of the entire sovereign debt base.
Frequently Asked Questions
Why does the GDP deflator often report a lower inflation rate than the CPI during oil shocks?
During global oil price spikes, imported petroleum inflates consumer gasoline and heating costs, driving up the Consumer Price Index. However, because imported crude oil is an import rather than domestic production, its direct purchase cost is excluded from the GDP deflator. Only the domestic refining and distribution markups enter the deflator, causing the deflator to rise much more slowly than CPI during imported energy shocks.
How often is the GDP deflator published?
In the United States, the GDP deflator is released quarterly by the Bureau of Economic Analysis alongside the headline GDP report. It undergoes three successive monthly releases for each quarter: the Advance Estimate, the Second Estimate, and the Third (Final) Estimate, followed by annual comprehensive benchmark revisions.
Can the GDP deflator ever be negative?
Yes. If the aggregate price level of domestically produced goods and services declines year-over-year, the percentage change in the GDP deflator turns negative, signaling economy-wide deflation. This phenomenon occurred frequently in Japan during the late 1990s and 2000s, and in several advanced economies during the depth of the 2008-2009 global financial crisis.
Ready to trade forex?
Open a free demo account with a regulated broker. Practice with virtual funds before risking real money.