Kijun line
The Kijun line, or Kijun-sen, is the 26-period base line within the Ichimoku Kinko Hyo charting system, calculated as the midpoint between the 26-period highest high and lowest low to identify medium-term trend direction, dynamic support, and market equilibrium.
What Is the Kijun Line?
The Kijun line (referred to in Japanese as the Kijun-sen, meaning “Standard Line” or “Base Line”) is one of the five core components of the Ichimoku Kinko Hyo charting framework. Developed in the late 1930s by Japanese journalist Goichi Hosoda (who published under the pen name Ichimoku Sanjin), the system provides traders with an immediate visual equilibrium gauge of market trend, momentum, support, and resistance.
While retail traders often confuse the Kijun line with a conventional moving average, its mathematical construction and behavioral characteristics are distinctly different. By measuring the true 50% price retracement midpoint over a 26-period lookback window, the Kijun line serves as a dynamic barometer of medium-term market equilibrium. When price stretches too far from the Kijun line, institutional order flow frequently forces a mean-reverting pullback toward this baseline.
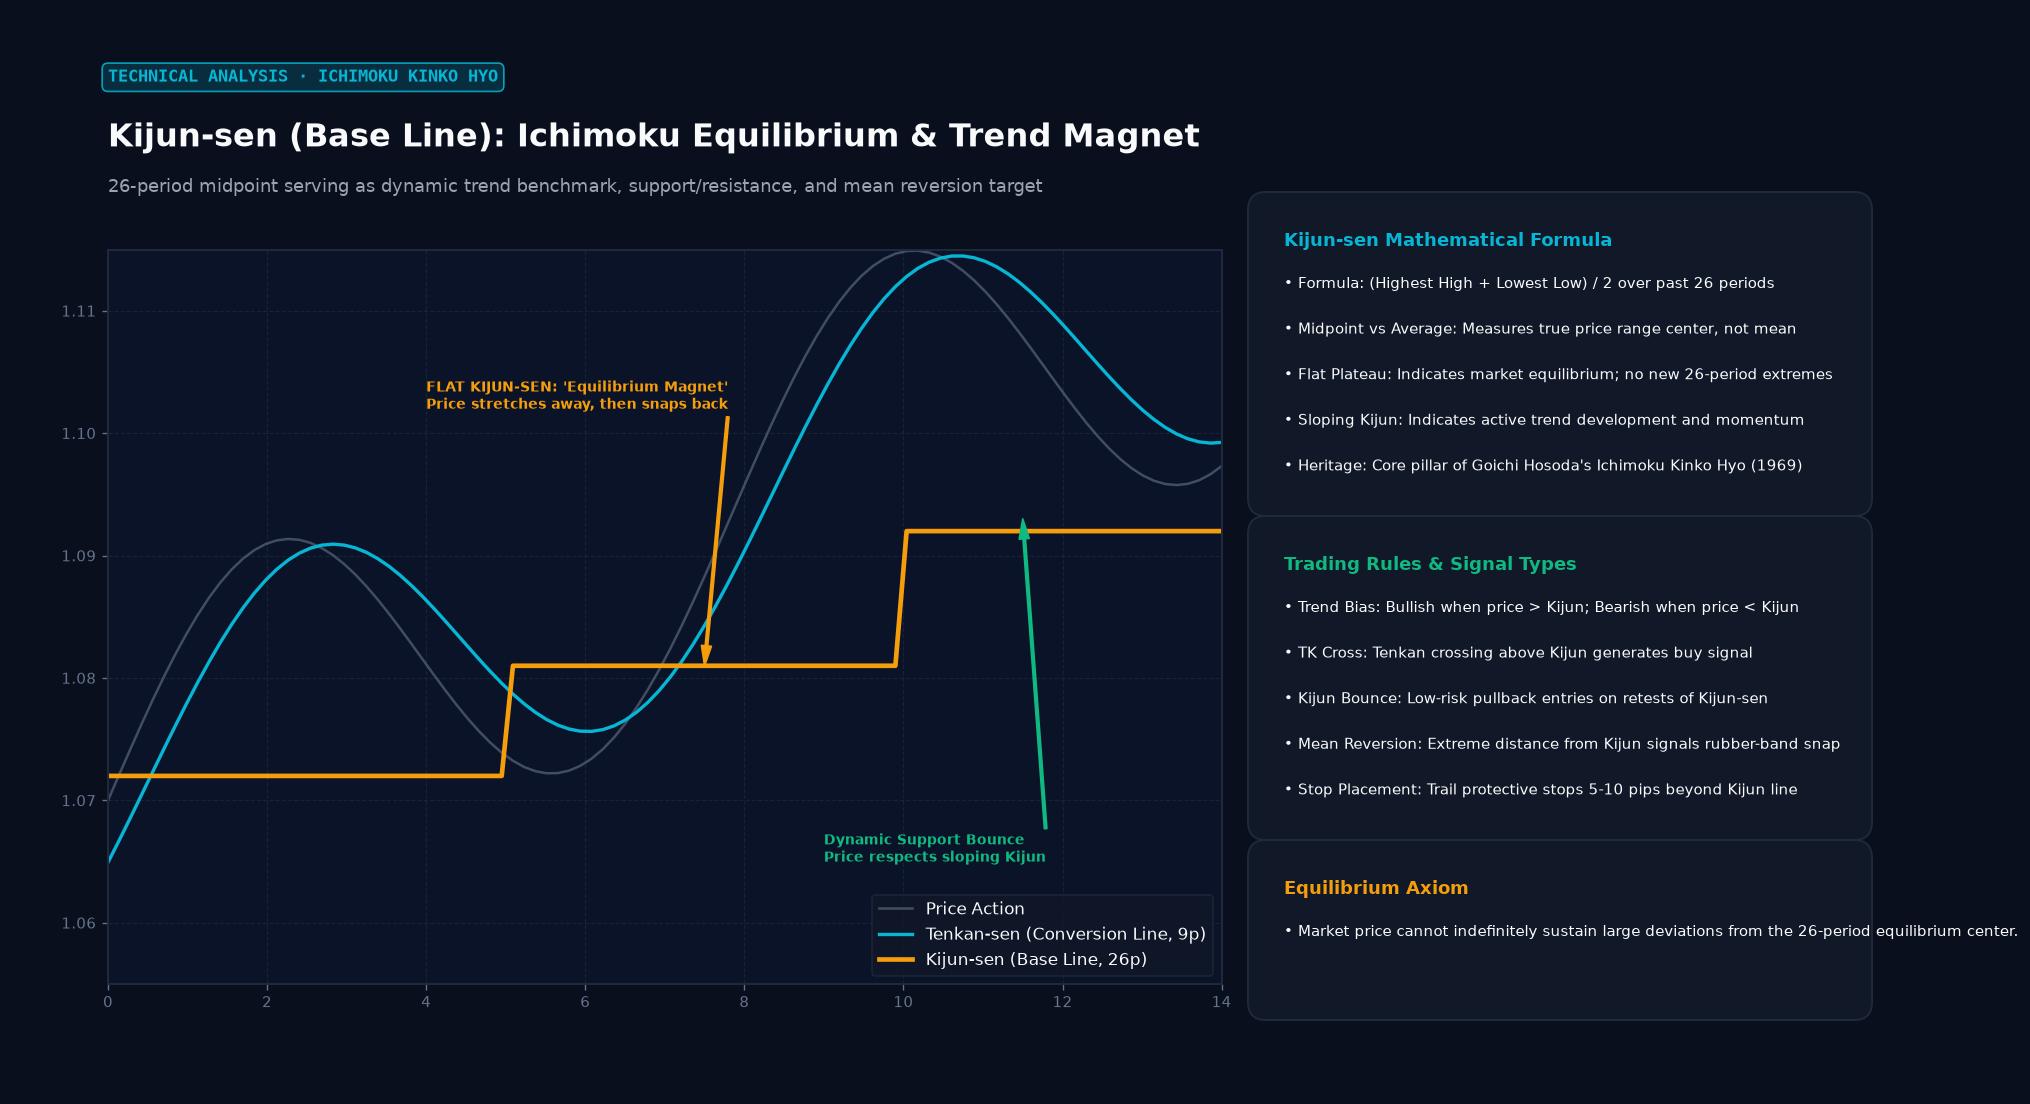 Figure: 26-period midpoint serving as dynamic trend benchmark, support/resistance, and mean reversion target
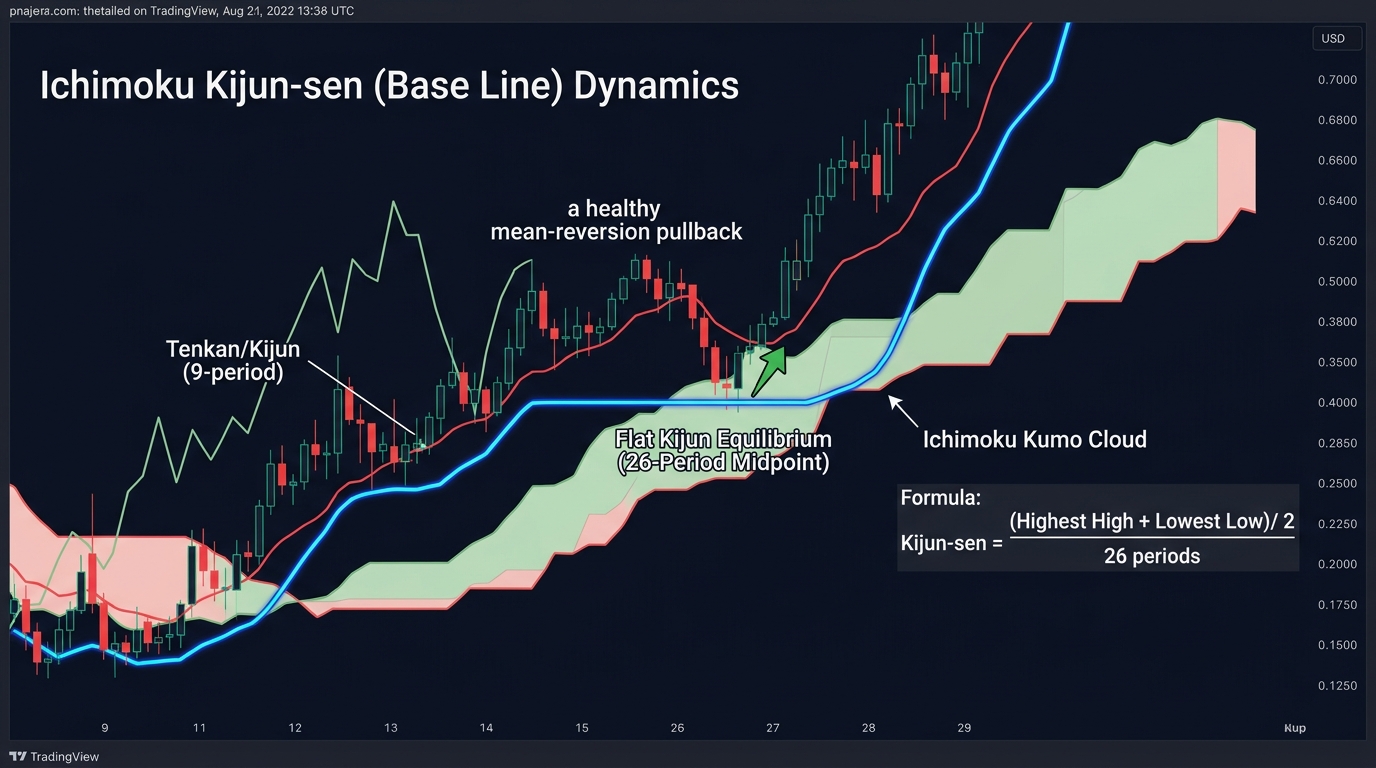
Mathematical Formula and Calculation Mechanics
The calculation of the Kijun line differs fundamentally from exponential or simple moving averages because it completely ignores intermediate closing prices. Instead, it captures the geometric midpoint between the absolute extremes recorded across the preceding 26 periods:
             Highest High (26 periods) + Lowest Low (26 periods)
Kijun-sen = -----------------------------------------------------
                                      2
Calculation Steps on Any Timeframe:
- Examine the price action across the preceding 26 candlestick intervals (whether 1-minute bars, 4-hour candles, or daily sessions).
- Locate the highest high achieved within that 26-period window.
- Locate the lowest low achieved within that same 26-period window.
- Add the highest high to the lowest low, and divide the sum by 2.
- Plot the resulting value on the active chart.
Because traditional Japanese financial markets operated six days a week in the 1930s, Hosoda selected 26 periods to represent roughly one full month of commercial trading activity. In modern 24-hour forex and five-day equity markets, quantitative traders still retain the traditional 26-period default because billions of dollars in global algorithmic capital monitor this exact parameter.
Kijun Line vs Simple Moving Average (SMA)
To utilize the Kijun line effectively, a trader must understand how its behavior diverges from a standard 26-period Simple Moving Average:
| Feature | Kijun-sen (Base Line) | 26-Period Simple Moving Average (SMA) |
|---|---|---|
| Data Inputs | Only the highest high and lowest low | Closing price of every single bar |
| Line Geometry | Moves in steps; forms long horizontal “flat” plateaus | Constantly slopes upward or downward |
| Equilibrium Meaning | Represents the true 50% Fibonacci price retracement level | Represents the rolling arithmetic average |
| Support / Resistance | Flat plateaus create formidable structural price barriers | Sloping averages offer softer, less predictable support |
| Lag Characteristics | Freezes in place until price breaks past 26-period highs/lows | Reacts smoothly to every new closing price |
When the Kijun line goes completely flat, it reveals that neither buyers nor sellers have been able to establish a new 26-period price extreme. This flat zone acts as a market magnet. If price surges upward without creating a new 26-period low, the Kijun line remains flat beneath the market, establishing a natural support zone for dip buyers.
Core Trading Strategies Using the Kijun Line
Institutional traders and technical analysts deploy the Kijun line in three distinct strategic setups:
1. The Tenkan-sen / Kijun-sen (TK) Cross
The interaction between the faster 9-period conversion line (Tenkan-sen) and the slower 26-period Kijun-sen mirrors the classic moving average crossover, but with greater predictive stability:
- Bullish TK Cross: Occurs when the Tenkan-sen crosses above the Kijun-sen.
- Bearish TK Cross: Occurs when the Tenkan-sen crosses below the Kijun-sen.
In the complete Ichimoku framework, the strength of a TK Cross is categorized relative to the Kumo (the Cloud):
+-------------------------------------------------------------------------+
|                  TK CROSS SIGNAL CLASSIFICATION                         |
+-------------------------------------------------------------------------+
|                                                                         |
|  SIGNAL TYPE         POSITION RELATIVE TO CLOUD (KUMO)   SIGNAL STRENGTH|
|                                                                         |
|  Bullish TK Cross    Occurs ABOVE the Kumo Cloud         Strong Buy     |
|  Bullish TK Cross    Occurs INSIDE the Kumo Cloud        Neutral / Hold |
|  Bullish TK Cross    Occurs BELOW the Kumo Cloud         Weak Buy       |
|                                                                         |
|  Bearish TK Cross    Occurs BELOW the Kumo Cloud         Strong Sell    |
|  Bearish TK Cross    Occurs INSIDE the Kumo Cloud        Neutral / Hold |
|  Bearish TK Cross    Occurs ABOVE the Kumo Cloud         Weak Sell      |
|                                                                         |
+-------------------------------------------------------------------------+
2. The Kijun Bounce (Trend Retracement Entry)
During a sustained trend, price often pulls back to test the Kijun line. Because the Kijun-sen reflects the 50% balance point of the last 26 bars, trend-following funds look for bullish candlestick reversal patterns (such as hammers or engulfing bars) precisely when price touches a rising Kijun line. Entering long on a Kijun bounce offers favorable risk-to-reward ratios because the protective stop-loss can be positioned immediately below the Kijun line.
3. Dynamic Trailing Stop Execution
The Kijun line provides an objective, rule-based trailing stop for open positions. In a long position, a trader trails their stop-loss just beneath the Kijun-sen. As price reaches new swing highs, the Kijun line steps upward, systematically locking in accrued profits. A trade is liquidated only when a candle closes definitively below the Kijun line, preventing premature exits during minor intraday noise.
Common Pitfalls and Execution Traps
Traders working with the Kijun line must guard against specific market traps:
- Trading Crossovers in Range-Bound Markets: In sideways, consolidating markets, the Kijun line flattens out, and the Tenkan-sen repeatedly crosses back and forth across it. Executing every TK cross in a choppy consolidation produces severe whipsaw losses. Traders should only take TK crosses when price has broken clear of the Kumo cloud.
- Ignoring the Slope of the Line: A horizontal Kijun line indicates market indecision and equilibrium. Entering momentum breakout trades when the Kijun line is completely flat often results in failure; high-probability trend trades require the Kijun line to slope decisively in the direction of the trade.
- Overextending from the Baseline: When price trades far above a flat Kijun line, the market is severely overbought. Buying at the peak of such an extension exposes the trader to sharp mean-reverting pullbacks back toward the Kijun line.
Key Takeaways
- The Kijun line (Kijun-sen) is the 26-period base line of the Ichimoku Kinko Hyo system, calculated as the midpoint between the 26-period highest high and lowest low.
- Unlike a moving average based on closing prices, the Kijun line identifies the true 50% price retracement equilibrium over 26 sessions.
- Horizontal, flat Kijun segments represent balance points and serve as major support and resistance zones.
- The Tenkan/Kijun (TK) cross provides actionable entry signals, with signal reliability heavily dependent on whether the cross occurs above, inside, or below the Kumo cloud.
- The Kijun line functions as an objective dynamic trailing stop for trend-following strategies in forex, equities, and commodities.
Frequently Asked Questions
What does the word “Kijun” mean in English?
In Japanese, “Kijun” translates directly to “standard”, “norm”, or “criterion”. In the context of Ichimoku technical analysis, it designates the baseline standard against which current price momentum and short-term movements are evaluated.
Can the 26-period setting on the Kijun line be changed for modern markets?
While some intraday traders experiment with settings like 30 or 60 periods for cryptocurrency or continuous forex markets, changing the default 26 setting diminishes the indicator’s self-fulfilling institutional power. Most professional desks retain 26 because widespread charting algorithms monitor this exact parameter.
How does the Kijun line relate to Senkou Span B in the Ichimoku Cloud?
The Kijun line forms the conceptual basis for Senkou Span B (the slower boundary of the Kumo Cloud). While the Kijun line calculates the midpoint of the past 26 periods, Senkou Span B calculates the midpoint of the past 52 periods and shifts that value 26 periods forward into the future.
Ready to trade forex?
Open a free demo account with a regulated broker. Practice with virtual funds before risking real money.