MACD (Moving Average Convergence Divergence)
MACD is a trend-following momentum indicator that shows the relationship between two exponential moving averages of price — typically the 12-period and 26-period EMA. The MACD line, signal line, and histogram together identify trend direction, momentum shifts, and potential entry points.
What Is MACD and Why Traders Still Use It
Gerald Appel introduced the MACD in the late 1970s, and despite five decades of new indicator development, it remains one of the most widely deployed technical tools in the world. That staying power isn’t nostalgia — it’s because the MACD encodes genuinely useful information about both trend direction and momentum in a single visual display.
The MACD is built from three components, each answering a different question about price behavior.
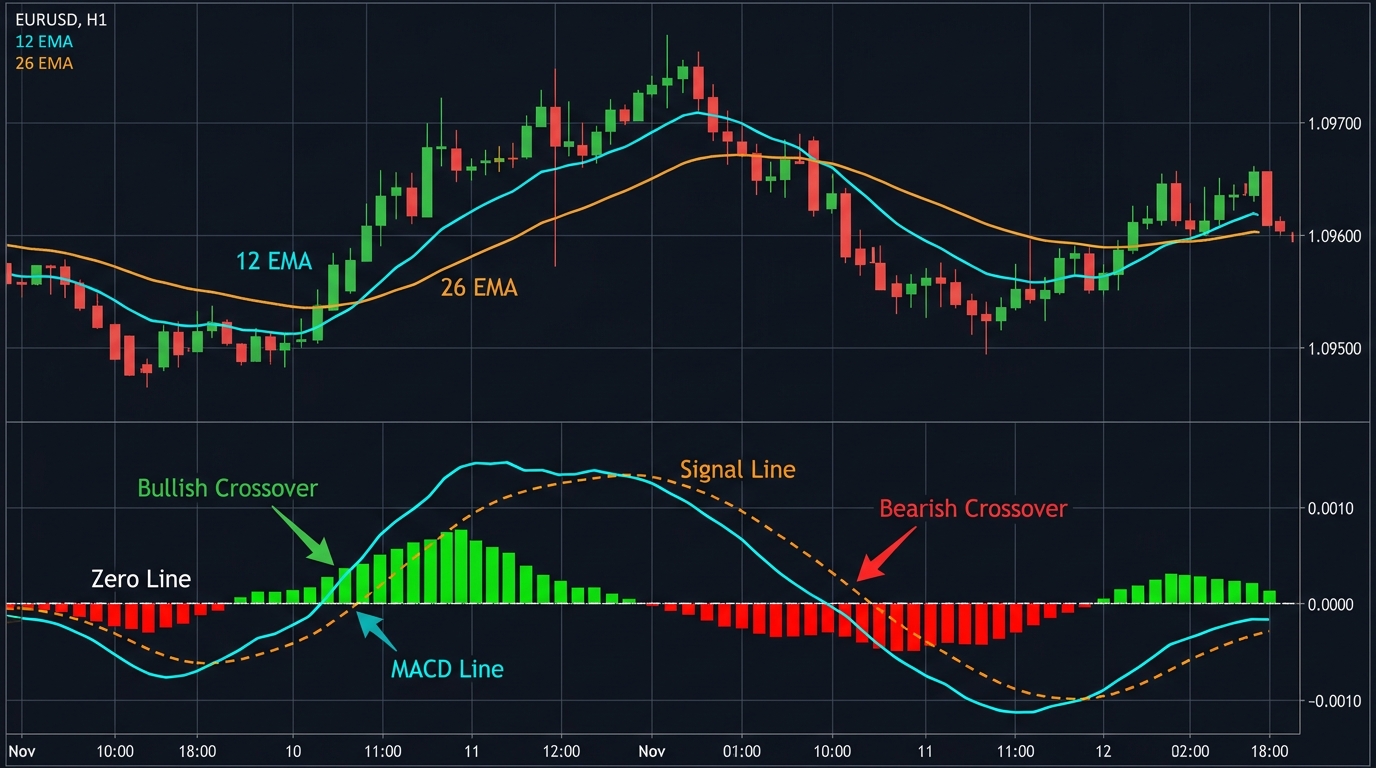
The Three Components
MACD Line: Calculated as the 12-period EMA minus the 26-period EMA. When this value is positive, the shorter-term average is above the longer-term average — upward momentum is in play. When negative, the opposite.
Signal Line: A 9-period EMA of the MACD line itself. Smoothing the MACD line creates a reference point for crossover signals. When the MACD line crosses above the signal line, it’s interpreted as a bullish signal. Crosses below are bearish.
Histogram: The visual bar chart showing the difference between the MACD line and the signal line. When the histogram is expanding (bars growing taller), momentum is accelerating. When it’s contracting (bars shrinking), momentum is fading — often the earliest warning of a potential trend shift.
The default settings — 12, 26, 9 — are Appel’s originals and remain standard. Many active traders use adjusted settings (8, 17, 9 or 5, 13, 9) on shorter timeframes for more responsive signals, but these require backtesting validation before live use.
MACD Crossover Signals
The most basic MACD application: buy when the MACD line crosses above the signal line, sell when it crosses below.
In trending markets, this works well. In choppy, sideways conditions, MACD crossovers generate numerous false signals as the two lines repeatedly intersect without any real directional follow-through. This is the MACD’s primary weakness — it’s a trend-following tool that struggles in range-bound environments.
A practical filter: only take MACD crossover signals when the histogram was already contracting for at least two consecutive bars before the crossover. This screens out impulsive crossovers that happen in the middle of noise.
Histogram Divergence: The Advanced Read
Like RSI, the MACD histogram generates its most powerful signals through divergence — when price and the histogram disagree about momentum.
Bearish histogram divergence: Price makes a new high, but the MACD histogram’s peak is lower than the previous high. Momentum is waning at the new price extreme. This frequently precedes a reversal.
Bullish histogram divergence: Price makes a new low, but the histogram’s trough is shallower than the previous low. Sellers are running out of force.
Histogram divergences are visible earlier than zero-line crossovers — which makes them genuinely useful for anticipating trend changes rather than confirming them after the fact. However, they require confirmation before acting: a histogram divergence alone, without a candlestick reversal pattern or a break of a key price level, is premature.
Zero-Line Crossovers
When the MACD line crosses the zero axis (moving from negative to positive territory), it means the 12-period EMA has crossed above the 26-period EMA — in other words, short-term price is now above long-term price. This is equivalent to a moving average crossover and carries the same implications: a trend change at the intermediate horizon.
Zero-line crossovers are slower and more lagging than signal-line crossovers, but they also produce significantly fewer false signals. Some traders use zero-line crossovers exclusively as a directional filter, only taking long trades when MACD is above zero and shorts when it’s below.
Combining MACD with Other Tools
MACD works best as part of a multi-factor decision framework rather than as a standalone system.
Effective combinations:
- MACD + RSI: MACD identifies trend direction and momentum; RSI identifies overbought/oversold conditions for timing entries within the trend
- MACD + Support/Resistance: Only act on MACD signals at key price levels, filtering out mid-range signals
- MACD + Moving Averages: MACD crossover signals that occur above the 200 SMA (uptrend) have historically stronger follow-through than those occurring below
Key Takeaways
- MACD = 12-period EMA minus 26-period EMA, with a 9-period signal line and histogram
- Crossovers (MACD over signal line) identify momentum direction shifts
- Histogram divergence detects momentum fading before price reversal — the earliest signal
- Zero-line crossovers are slower but more reliable as trend-direction filters
- MACD performs well in trending markets, poorly in choppy, sideways conditions
FAQ
What’s the difference between MACD and MACD histogram? The MACD line and signal line are two separate lines. The histogram is simply the visual representation of the gap between them — it expands when they diverge and contracts when they converge. Some platforms display only the histogram; others show all three components together.
Should I change MACD settings for different timeframes? The default 12/26/9 works across timeframes. Shortening the settings (e.g., 8/17/9) increases sensitivity and generates more signals but also more noise. Only change defaults if you have documented backtested evidence that alternate settings improve performance on your specific instrument and timeframe.
Ready to trade forex?
Open a free demo account with a regulated broker. Practice with virtual funds before risking real money.