Stochastic Oscillator
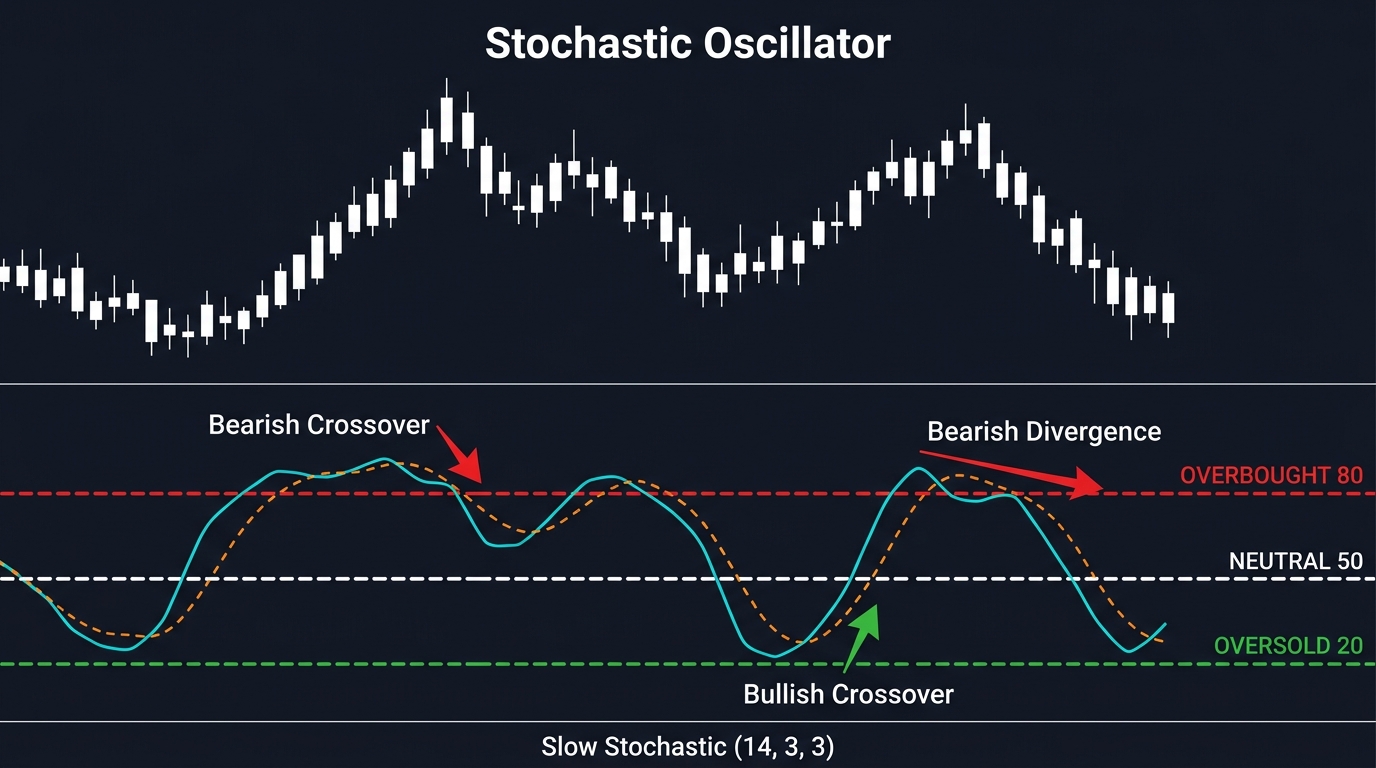
The Stochastic Oscillator is a momentum indicator developed by George Lane in the 1950s that compares a closing price to the price range over a specified lookback period, on a scale of 0 to 100. It identifies overbought conditions (above 80) and oversold conditions (below 20), and generates buy/sell signals through crossovers of its two lines: %K (the main line) and %D (the signal line).
Understanding Stochastic Logic
The Stochastic Oscillator is built on a specific observation about market behavior: in an uptrend, closing prices tend to cluster near the high of the trading range; in a downtrend, they cluster near the low. When this relationship breaks down — when closing prices drift toward the lower end of the range during an uptrend (or vice versa) — it signals weakening momentum.
George Lane formalized this into a formula:
%K = (Current Close − Lowest Low) / (Highest High − Lowest Low) × 100
Where the Lowest Low and Highest High are measured over the lookback period (default: 14 periods).
A %K reading of 85 means today’s close is at 85% of the full high-low range over the lookback period — near the top of recent price action. A reading of 15 means it’s near the bottom.
The %D line is a 3-period simple moving average of %K — a smoothed version that generates cleaner signals.
Overbought and Oversold: The Standard Reading
By convention: above 80 = overbought; below 20 = oversold.
The same contextual caution applies as with RSI: in a strong uptrend, the Stochastic can remain above 80 for many periods without a significant reversal. Simply selling every time the Stochastic crosses into overbought territory will consistently lose money in trending conditions.
The most reliable Stochastic signals occur at extremes in the context of a broader pattern — for example, a reading below 20 with a bullish divergence at a major support level carries far more weight than an isolated low reading in the middle of a range.
The %K / %D Crossover Signal
The primary trading signal: when %K crosses above %D from below 20, it generates a buy signal. When %K crosses below %D from above 80, it generates a sell signal.
Signal quality hierarchy:
- Crossover inside the overbought/oversold zone (highest quality — confirmed by extreme momentum)
- Crossover just as the lines exit the extreme zone (re-crossing 80 on the way down, or 20 on the way up)
- Crossover in the middle zone (lowest quality — too many false signals)
Many traders only act on Stochastic signals when the crossover occurs within or near the extreme zones, filtering out the numerous mid-range crossovers that produce more noise than signal.
Fast, Slow, and Full Stochastic
Fast Stochastic: Uses the raw %K and %D calculations. More sensitive, more signals, more noise. Rarely recommended for forex.
Slow Stochastic: The standard recommendation. The raw %K is smoothed by a 3-period MA to create a new “smooth %K,” then a new %D is calculated as a 3-period MA of that. Settings notation: (14, 3, 3) means 14-period lookback, 3-period slow %K, 3-period %D.
Full Stochastic: The most flexible version, where all three smoothing parameters can be adjusted independently.
For most forex applications, the Slow Stochastic (14, 3, 3) is the standard starting point.
Stochastic Divergence: The Most Powerful Signal
Like RSI, the Stochastic generates its most reliable signals through divergence with price:
Bullish divergence: Price makes a new low, but the Stochastic makes a higher low (below 20). Momentum is recovering even as price makes fresh lows. Combined with a support level and a bullish candlestick, this is a high-probability long setup.
Bearish divergence: Price makes a new high, but the Stochastic makes a lower high (above 80). Selling momentum is increasing even as price reaches new heights. Combined with resistance and a bearish candle, it’s a reliable short setup.
Stochastic vs. RSI: Which to Use
Both are momentum oscillators in the 0-100 range, but they measure different things:
- RSI measures the speed and consistency of price changes (momentum of closes)
- Stochastic measures where the close is within the recent price range (position within range)
The Stochastic reacts faster than RSI (more crossovers, more signals) and is generally more prone to false signals in trending markets. RSI is smoother and tends to hold in overbought/oversold territory longer during trends.
Many traders use both: RSI for trend direction and broader momentum context; Stochastic for timing precise entries within that context.
Key Takeaways
- Stochastic Oscillator (0-100): above 80 = overbought, below 20 = oversold
- The %K/%D crossover inside extreme zones is the primary signal — avoid middle-range crossovers
- Slow Stochastic (14, 3, 3) is the standard setting for most forex applications
- Divergence (price vs. Stochastic) at extremes is the most reliable signal type
- Use alongside RSI and price structure for confirmation — standalone Stochastic signals have a high false-positive rate
FAQ
Why does the Stochastic give so many false signals? Because it’s very sensitive — it oscillates rapidly between overbought and oversold in trending markets. The solution is to filter signals: only trade in the direction of the higher-timeframe trend, only act on crossovers at extremes, and require price action confirmation before entering. Raw Stochastic crossover systems without filters consistently underperform.
What’s a good Stochastic setting for different timeframes? The default (14, 3, 3) works reasonably across timeframes. Some traders use shorter periods (5, 3, 3) on 15-minute charts for more responsive signals. Longer periods (21, 5, 5) on daily charts smooth out noise. Backtest any non-default setting on your specific instrument before using it live.
Ready to trade forex?
Open a free demo account with a regulated broker. Practice with virtual funds before risking real money.