Moving Average Convergence / Divergence (MACD)
The Moving Average Convergence Divergence (MACD) is a classic trend-following momentum oscillator that displays the mathematical relationship between two exponential moving averages of an asset's price, generating trade signals via line crossovers, centerline breaches, and divergences.
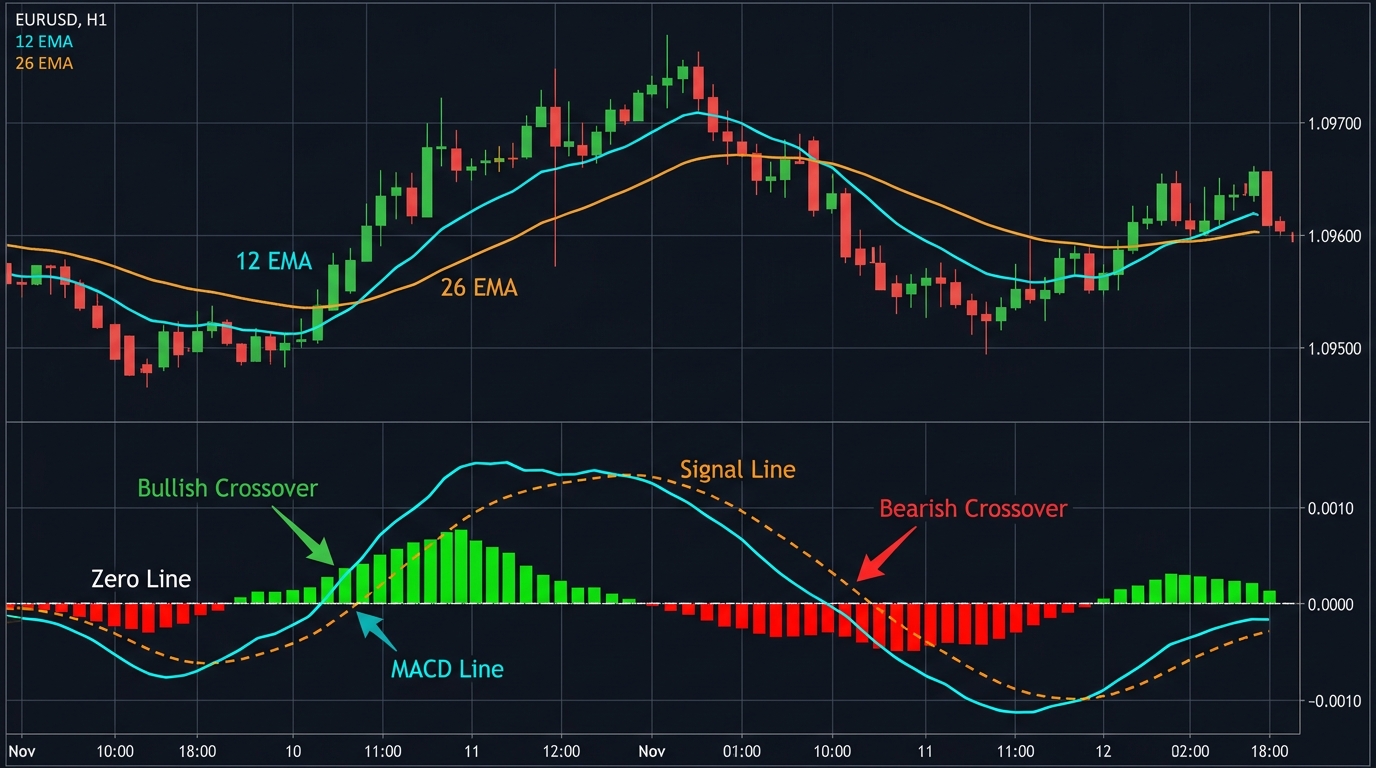
What Is the Moving Average Convergence / Divergence (MACD)?
Created by financial analyst Gerald Appel in the late 1970s, the Moving Average Convergence / Divergence (MACD) is one of the most versatile and ubiquitous technical analysis indicators in modern trading. Designed as a trend-following momentum oscillator, the MACD converts two distinct trend-following lag indicators (exponential moving averages) into a dynamic momentum oscillator by subtracting the longer-term moving average from the shorter-term moving average.
In 1986, Thomas Aspray added the MACD Histogram, visualizing the difference between the MACD line and its trigger signal line. This structural addition transformed the tool from a simple lagging crossover system into a predictive leading indicator capable of identifying momentum deceleration and trend exhaustion before price actually reverses on the chart.
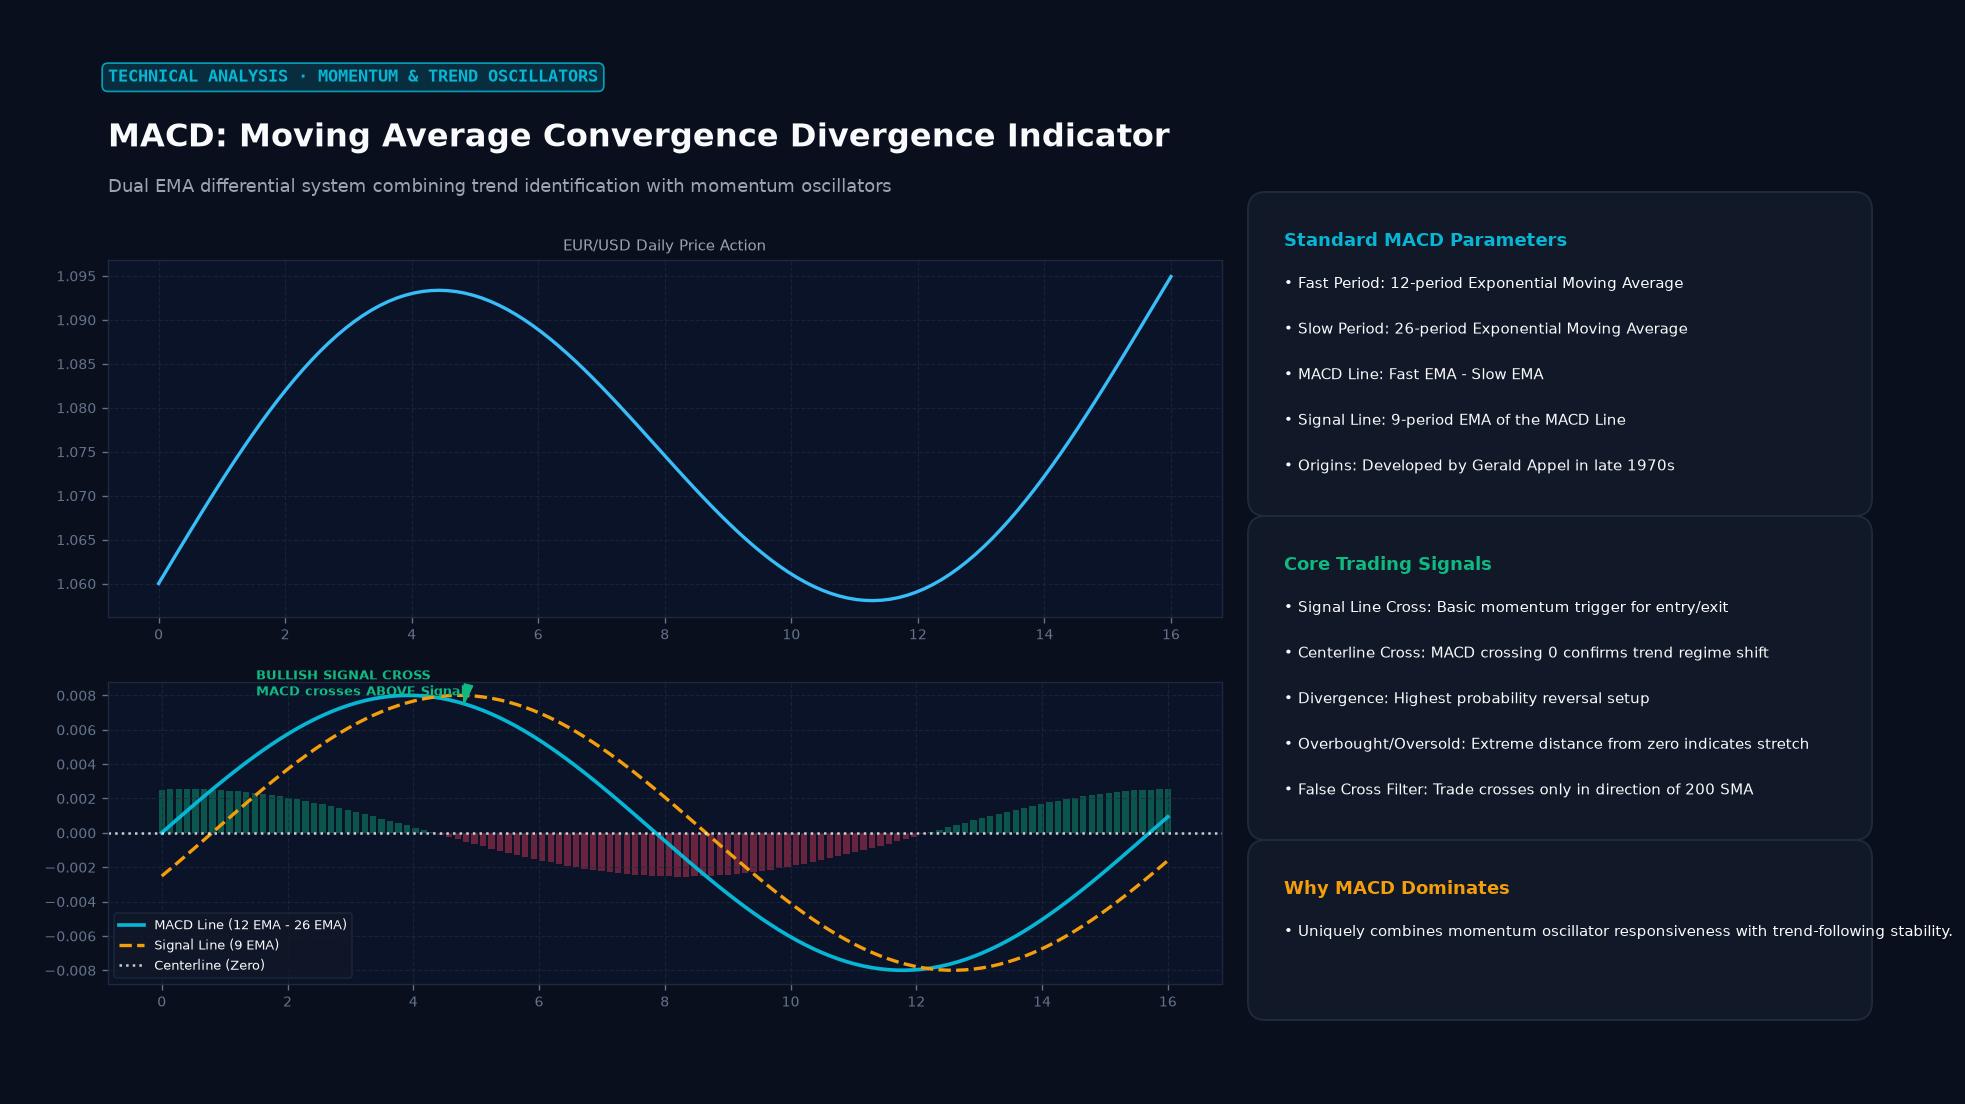 Figure: Dual EMA differential system combining trend identification with momentum oscillators
Key Takeaways
- The Tripartite Construction: The indicator comprises three interrelated elements: the MACD Line, the Signal Line, and the Histogram.
- Default Parameters: Standardized universally as (12, 26, 9)—representing the 12-period fast EMA, the 26-period slow EMA, and the 9-period signal EMA.
- Three Core Signal Engines: Traders extract trade signals through Signal Line Crossovers, Zero-Line Crossovers, and Momentum Divergences.
- Lagging Trend + Leading Momentum: While moving averages are inherently lagging, the contraction of the MACD Histogram provides leading insight into fading momentum ahead of price turns.
- Whipsaw Vulnerability in Consolidations: Like all moving average derivatives, the MACD performs exceptionally well in sustained directional trends, but generates severe false signals during tight, range-bound consolidations.
The Mathematical Formulas of the MACD
The MACD is computed through three sequential mathematical equations:
1. The MACD Line
Calculated as the difference between the 12-period Exponential Moving Average (Fast) and the 26-period Exponential Moving Average (Slow) of the closing price:
$$\text{MACD Line} = \text{EMA}{12}(\text{Close}) - \text{EMA}{26}(\text{Close})$$
2. The Signal Line
A 9-period exponential smoothing of the MACD Line itself:
$$\text{Signal Line} = \text{EMA}_9(\text{MACD Line})$$
3. The MACD Histogram
The vertical bar chart representing the spread between the MACD Line and the Signal Line:
$$\text{Histogram} = \text{MACD Line} - \text{Signal Line}$$
When the MACD line is above the Signal Line, the histogram is positive (above zero); when the MACD line drops below the Signal line, the histogram flips negative (below zero).
Comparative Taxonomy: Momentum Indicators
| Feature | MACD | Relative Strength Index (RSI) | Stochastic Oscillator |
|---|---|---|---|
| Indicator Type | Unbounded Momentum / Trend | Bounded Oscillator (0 to 100) | Bounded Oscillator (0 to 100) |
| Mathematical Core | Difference between two EMAs | Ratio of average gains to losses | Current close relative to High/Low range |
| Overbought / Oversold | No fixed numerical limits | Fixed levels (Overbought: 70 / Oversold: 30) | Fixed levels (Overbought: 80 / Oversold: 20) |
| Best Market Regime | Trending / Macro Trend Following | Mean-reverting / Channel trading | Range-bound consolidations |
| Primary Strength | Visualizing trend acceleration/exhaustion | Momentum exhaustion & divergence | Fast timing for intraday reversals |
The Three Primary Trading Signals
1. Signal Line Crossovers (Tactical Timing)
- Bullish Signal: The MACD Line crosses above the Signal Line. (The histogram ticks up from negative to positive). Indicates accelerating upside momentum.
- Bearish Signal: The MACD Line crosses below the Signal Line. Indicates accelerating downside momentum.
2. Zero-Line Crossovers (Structural Trend Confirmation)
- Bullish Trend: When the MACD Line crosses above zero, it confirms that the 12 EMA has risen above the 26 EMA. The broader macro trend is definitively bullish.
- Bearish Trend: When the MACD Line crosses below zero, the 12 EMA is below the 26 EMA, confirming an institutional downtrend.
3. Regular Divergence (High-Probability Reversals)
- Bullish Divergence: Price creates a Lower Low, but the MACD Line or Histogram forms a Higher Low. This reveals that while price drifted lower, selling pressure has evaporated, signaling an imminent upward reversal.
- Bearish Divergence: Price makes a Higher High, but the MACD Line forms a Lower High, warning that the rally is running on thin volume and prone to collapse.
Practical Application: The Daily EUR/USD Divergence Reversal
Consider a swing trader monitoring a severe multi-month downtrend on EUR/USD.
- Price Action: EUR/USD falls from 1.1000 down to 1.0600 in Month 1, bounces to 1.0750, and then drops to print a new structural low at 1.0500 in Month 2.
- Indicator Reading:
- At the 1.0600 low, the MACD Line registered an extreme reading of -0.0120.
- At the new lower price low of 1.0500, the MACD Line registers -0.0045 (a significantly higher trough).
- Identification: The trader identifies a textbook Bullish Regular Divergence across daily charts: downward momentum is decaying despite lower prices.
- Execution: The trader waits for confirmation: on the subsequent session, the MACD Line crosses above the 9 EMA Signal Line, and price forms a bullish daily engulfing candle at 1.0540.
- Trade Management: The trader buys at 1.0550, placing a protective stop-loss below the 1.0490 swing low (60 pips risk). Over the subsequent three weeks, EUR/USD stages a powerful macro short squeeze, rallying 350 pips to 1.0900, yielding a superior 5.8:1 reward-to-risk outcome.
Critical Pitfalls and Limitations of the MACD
- Unbounded Nature: Because the MACD has no upper or lower boundary (unlike RSI, which is capped at 0–100), you cannot look at a historical MACD value and declare an asset definitively “overbought.” In parabolic trends, MACD can remain elevated for months.
- Late Entries in Volatile Reversals: In V-shaped flash crashes, the lagging nature of the 12 and 26 EMAs means a Signal Line crossover may not trigger until price has already recovered 50% of the move, forcing late traders to buy at the top.
Frequently Asked Questions (FAQ)
Can the MACD settings (12, 26, 9) be customized?
Yes. While (12, 26, 9) is the industry default developed for daily equity trading, intraday scalpers frequently use faster parameters (such as 5, 35, 5 or 3, 10, 16) to increase sensitivity, while long-term macro funds may widen settings (e.g., 24, 52, 18) to eliminate market noise.
What does it mean when the MACD histogram is flat at zero?
A flat histogram indicates that the MACD Line and the Signal Line are traveling at the identical value, signaling that price momentum is neutral and market volatility has compressed into a tight consolidation channel.
Is the MACD a leading or lagging indicator?
The MACD is fundamentally a hybrid indicator. The MACD Line and Zero-Line crossovers are lagging because they are derived from moving averages. However, the MACD Histogram and price divergences function as leading signals by identifying shifts in underlying momentum before price confirms the reversal.
Ready to trade forex?
Open a free demo account with a regulated broker. Practice with virtual funds before risking real money.