Exponential Moving Average (EMA)
An exponential moving average (EMA) is a technical trend indicator that places greater mathematical weight and significance on the most recent price data points, reducing lag and responding faster to price shifts than a simple moving average.
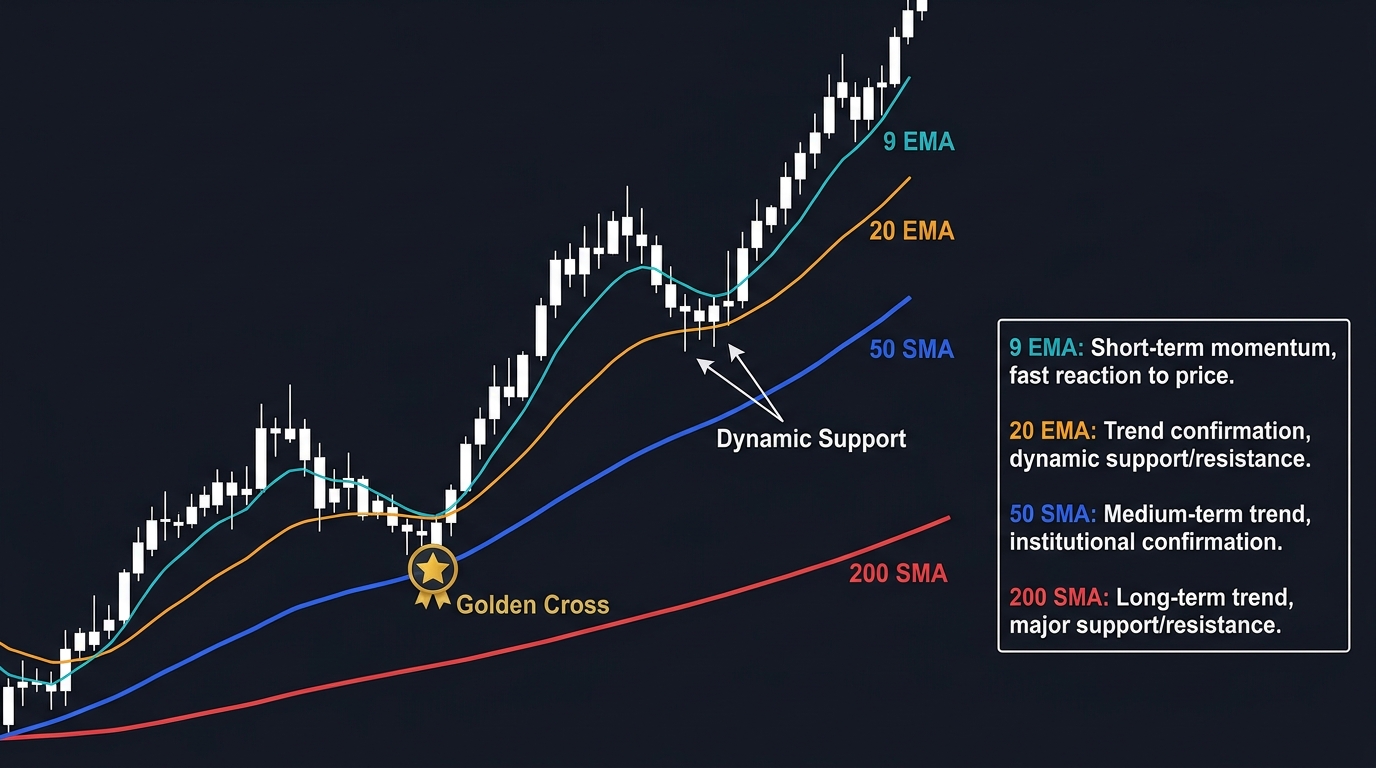
An Exponential Moving Average (EMA) is a core technical indicator used by currency traders to identify trend direction, gauge momentum, and pinpoint dynamic support and resistance levels. Unlike a Simple Moving Average (SMA), which calculates an arithmetic mean by treating all past prices with equal weight, the EMA applies an exponentially decaying weighting system.
By prioritizing recent candle closes, the EMA adapts quickly to emerging price volatility, offering earlier trend entry and exit cues while substantially reducing the visual and mathematical lag inherent in traditional moving averages.
Mathematical Formula and the Multiplier
The calculation of an EMA requires a smoothing constant (often called the multiplier or weighting factor $\alpha$), which depends on the chosen lookback period $N$:
$$\text{Multiplier } (\alpha) = \frac{2}{N + 1}$$
Once the multiplier is determined, the current period’s EMA is calculated using the following recursive formula:
$$\text{EMA}_t = \Big(\text{Price}t \times \alpha\Big) + \Big(\text{EMA}{t-1} \times (1 - \alpha)\Big)$$
Where:
- $\text{Price}_t$ is the closing price of the current period.
- $\text{EMA}_{t-1}$ is the EMA value of the preceding period (the initial value typically starts as an SMA of the first $N$ periods).
- $\alpha$ is the smoothing multiplier.
For example, a 20-period EMA has a multiplier of $\frac{2}{20 + 1} = 0.0952$ (9.52%). This means the latest closing price accounts for nearly 10% of the entire moving average value, while the remaining 90.48% is distributed across preceding historical bars with progressively diminishing weights.
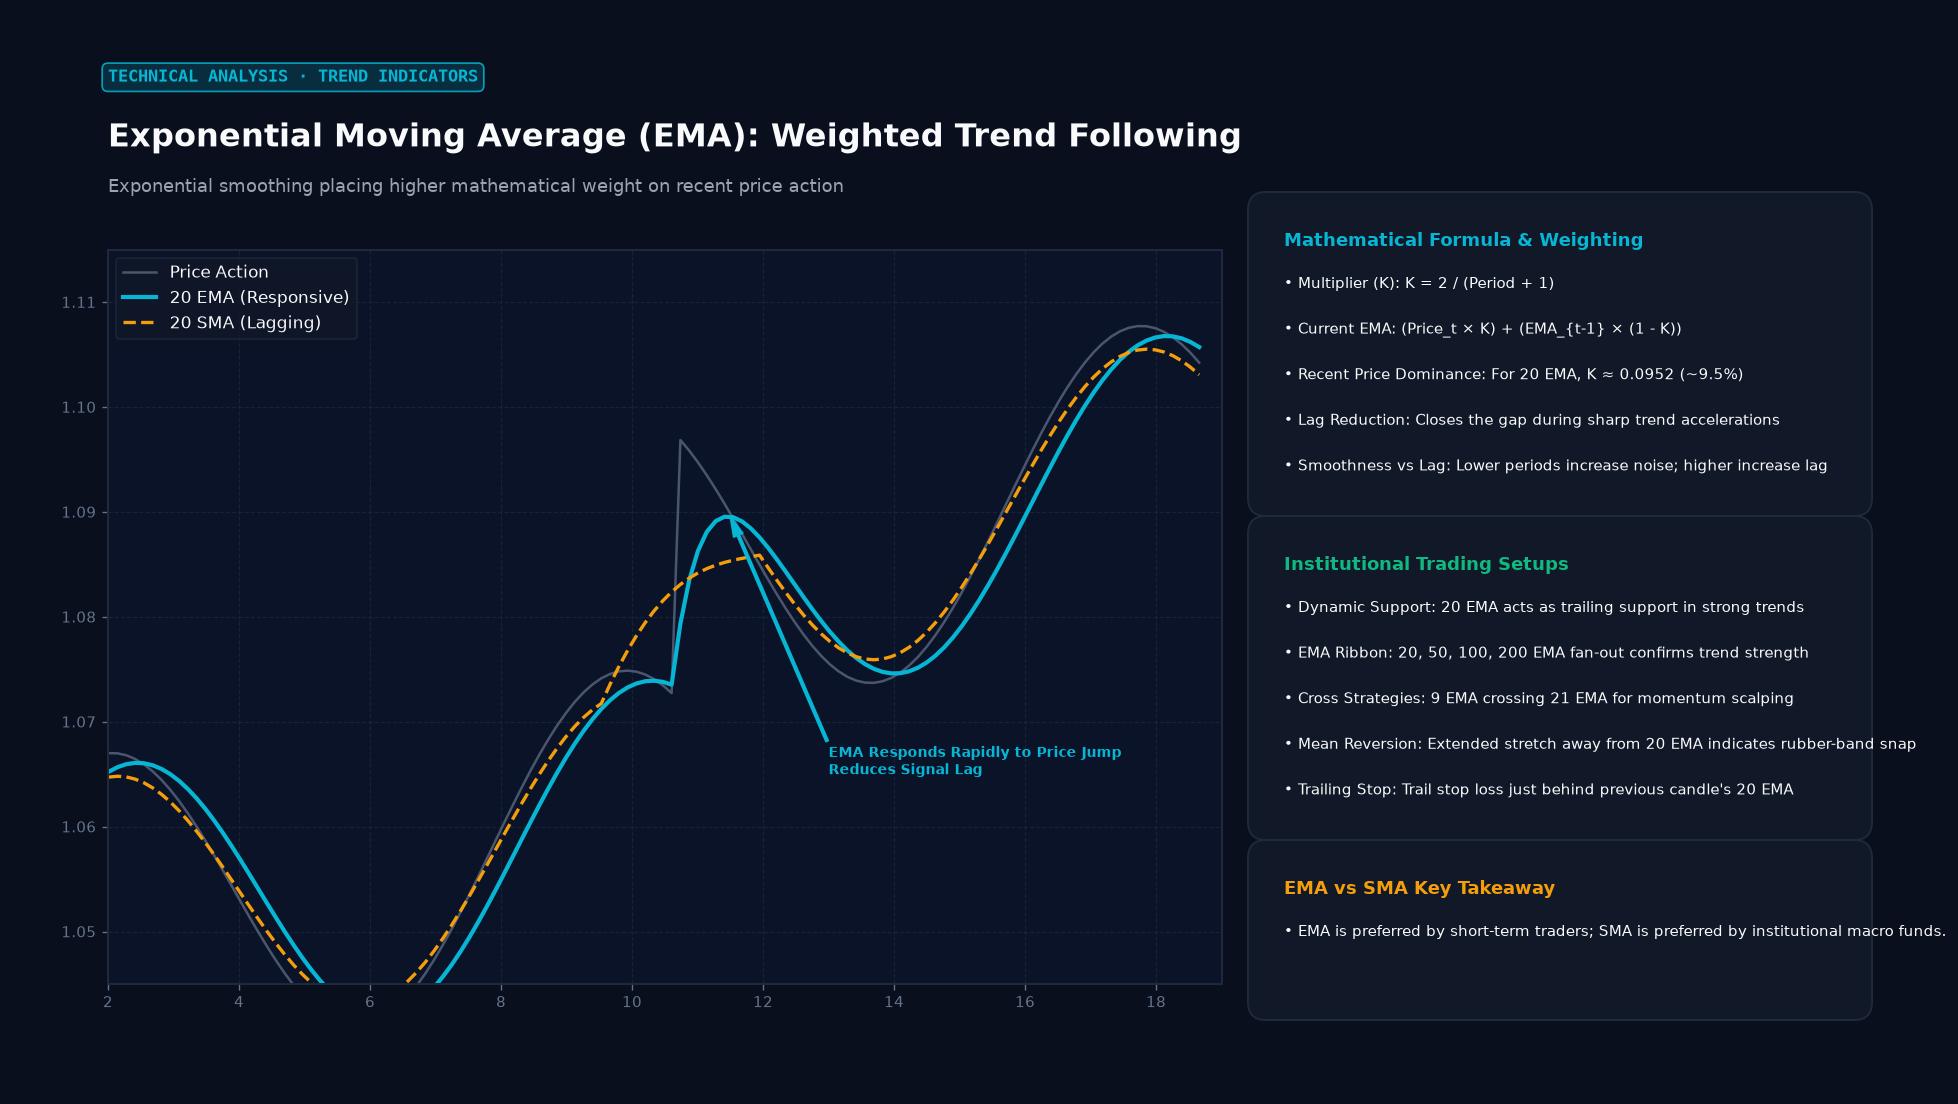 Figure: Exponential smoothing placing higher mathematical weight on recent price action
EMA vs. SMA: Key Differences
The primary critique of the Simple Moving Average is the “drop-off effect.” When a major price spike from $N$ days ago drops out of an SMA’s lookback window, the SMA line can jump or dip sharply even if current market prices are completely stable. The EMA prevents this distortion because older price points fade smoothly toward zero rather than abruptly falling off a calculation cliff.
| Feature | Exponential Moving Average (EMA) | Simple Moving Average (SMA) |
|---|---|---|
| Weighting Scheme | Exponential decay; recent bars weighted highest | Uniform arithmetic weight across all periods |
| Lag | Lower lag; turns quickly with price changes | Higher lag; slower to reflect rapid reversals |
| False Signal Risk | Higher in sideways, choppy consolidation | Lower; filters out brief price spikes |
| Best Used For | Fast trend entries, dynamic support, scalping | Long-term macro levels (e.g., 200-day institutional SMA) |
| Primary Formula | Recursive formula with multiplier $\alpha$ | Sum of closing prices divided by $N$ |
Popular EMA Periods in Currency Trading
- 9 or 10 EMA: Widely used by intraday scalpers to track immediate momentum and trail tight stops.
- 20 or 21 EMA: The classic swing-trading baseline. Currency pairs frequently pull back to the 21 EMA during strong, orderly trends.
- 50 EMA: Serves as the benchmark for intermediate trend health. Institutional desks track whether a currency is above or below its 50-day EMA.
- 200 EMA: The definitive long-term secular trend boundary. Institutional investors use it to distinguish structural bull regimes from bear regimes.
Practical Trading Strategies Using the EMA
1. Dynamic Support and Resistance
In a strong trending environment, price rarely pulls back all the way to horizontal support levels before resuming its directional run. Instead, the 20 or 50 EMA acts as a dynamic cushion. When EUR/USD trends upward, traders look for bullish candlestick patterns (such as hammer pins or bullish engulfing candles) that bounce directly off the rising 21 EMA.
2. Dual EMA Crossovers
Traders frequently pair a faster EMA with a slower EMA to create clear systematic triggers:
- Bullish Crossover: When a 12-period EMA crosses above a 26-period EMA, it signals accelerating upward momentum (this exact interaction forms the core of the MACD indicator).
- Bearish Crossover: When the 12-period EMA crosses below the 26-period EMA, it signals seller dominance and prompts short entries.
3. EMA Ribbons
An EMA ribbon stacks multiple averages—such as the 10, 20, 30, 40, and 50 EMAs—on a single chart. When the averages are expanding and fanning out smoothly in parallel, the trend is robust and high-probability. When the ribbon twists and compresses, the market has transitioned into a low-volatility consolidation phase.
Practical Example: A 21-EMA Trend Continuation on GBP/USD
Consider a daily chart of GBP/USD trending upward:
- Trend Validation: GBP/USD is trading cleanly above both its 50-day and 200-day EMAs, establishing a bullish institutional regime.
- The Pullback: After touching 1.3150, profit-taking sets in. Over three consecutive sessions, the pair pulls back toward the ascending 21-day EMA at 1.2980.
- The Signal: As price reaches 1.2985, buyers step in aggressively. The daily candle closes as a bullish rejection pinbar, leaving a long lower shadow that tests the 21 EMA before closing near the day’s high at 1.3020.
- Trade Execution:
- Entry: Long entry placed at 1.3030 on the break of the pinbar high.
- Stop-Loss: Placed 15 pips beneath the 21 EMA line and the pinbar low at 1.2965 (risking 65 pips).
- Take-Profit: Targeted at the previous structural swing high of 1.3160 (targeting 130 pips).
- Outcome: The dynamic 21 EMA holds support, and the pair reaches 1.3160 within seven sessions, achieving a 2:1 reward-to-risk ratio.
Limitations of the EMA
While the responsiveness of the EMA helps traders catch trends earlier, this sensitivity carries drawbacks. In non-trending, range-bound markets, the price will repeatedly oscillate back and forth through the EMA line, generating continuous false crossover signals. To avoid being whipsawed, currency traders generally confirm EMA signals using volume data, momentum oscillators like the RSI, or higher-timeframe market structure.
Key Takeaways
- Recent Price Focus: The EMA gives greater statistical weight to recent price action, reducing indicator lag compared to a simple moving average.
- No Drop-Off Distortion: By using an exponential multiplier, the EMA eliminates the abrupt price distortions caused by old data points dropping out of the lookback window.
- Dynamic Floors and Ceilings: The 21 and 50 EMAs frequently act as dynamic support during uptrends and dynamic resistance during downtrends.
- Crossover Signals: Pairings like the 9/21 EMA or 50/200 EMA generate directional trend shift signals.
- Chop Vulnerability: EMAs perform poorly during sideways consolidation, requiring trend filters to prevent false breakouts.
Frequently Asked Questions
Which is better for forex trading, EMA or SMA?
Neither is universally superior; they serve distinct tactical roles. Short-term day traders and swing traders prefer EMAs (like the 9, 20, or 21 period) because their rapid response captures quick momentum shifts. Long-term institutional investors often favor SMAs (particularly the 50-day and 200-day SMA) because the broader market watches and defends those exact arithmetic levels.
Why do some traders use 21 EMA instead of 20 EMA?
The 21 EMA is part of the Fibonacci sequence (1, 2, 3, 5, 8, 13, 21, 34…), which many technical traders believe naturally captures organic market pullbacks and cyclical waves. In practice, the difference between a 20-period and a 21-period EMA is negligible, but both serve as dynamic trend anchors.
Can an EMA be used as a standalone trading system?
Relying solely on an EMA crossover leads to heavy drawdown during range-bound market environments. Successful traders combine EMAs with price action, market structure, horizontal support and resistance, and risk management rules.
Ready to trade forex?
Open a free demo account with a regulated broker. Practice with virtual funds before risking real money.