Noise
Noise—or market noise—refers to the chaotic, short-term price fluctuations and random order-flow distortions that occur without fundamental catalysts, obscuring underlying structural trends.
What Is Market Noise?
In financial market microstructure and quantitative technical analysis, noise (commonly termed market noise) encompasses the erratic, short-lived price movements, intraday whipsaws, and random transactional fluctuations that occur without any connection to underlying macroeconomic fundamentals or structural institutional order flow.
In his seminal 1986 American Finance Association presidential address titled “Noise”, renowned financial economist Fischer Black established the theoretical foundation of the concept, famously observing that: “Noise makes financial markets possible, but it also makes them imperfect.” Black explained that without “noise traders”—participants who execute trades based on emotion, irrational beliefs, liquidity needs, or random impulses rather than factual information—markets would lack liquidity, and informed traders would have no counterparties against whom to profit.
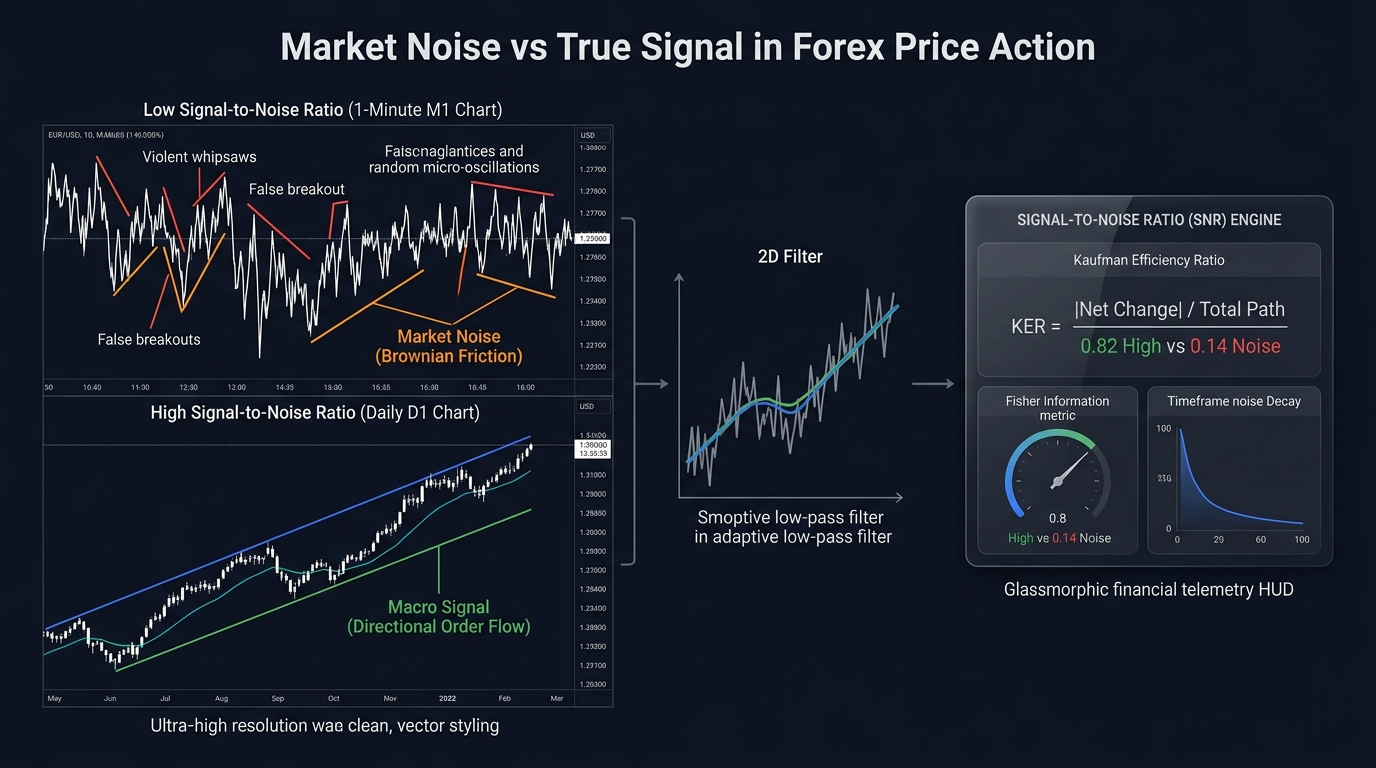
In modern foreign exchange (Forex) trading, noise is particularly prevalent on lower intraday timeframes (such as 1-minute, 5-minute, and 15-minute charts). Here, high-frequency trading (HFT) algorithms, spread-skews, and retail stop-hunting create visual turbulence that masks the primary, multi-week macroeconomic currency trends.
Key Takeaways
- The Information vs. Noise Dichotomy: Informed trading is driven by hard macroeconomic data and corporate cash flows; noise trading is driven by emotion, technical feedback loops, and intraday rebalancing.
- Signal-to-Noise Ratio (SNR): The ratio of clean, directional price movement to total accumulated volatility path. SNR expands exponentially as you ascend from lower to higher timeframes.
- The Scalper’s Dilemma: Intraday scalpers operating on 1-minute charts trade almost entirely inside market noise, where transaction spreads, commissions, and execution slippage consume a massive percentage of gross expectancy.
- Noise-Filtering Tools: Professional quantitative analysts deploy specialized mathematical filters—such as Exponential Moving Averages (EMA), Heikin-Ashi candlesticks, and Kaufman’s Adaptive Moving Average (KAMA)—to eliminate erratic ticks.
- False Breakout Engine: Most failed chart pattern breakouts on lower timeframes are products of transient market noise rather than true structural support/resistance breaches.
Comparative Taxonomy: Signal vs. Noise in Market Analysis
| Market Dimension | Market Noise | True Market Signal |
|---|---|---|
| Primary Driver | Algorithmic rebalancing, retail sentiment, execution ticks | Central bank policy, GDP growth, interest rate divergence |
| Duration | Seconds, minutes, to a few hours | Weeks, months, to multi-year secular cycles |
| Predictive Accuracy | Near zero (Random walk characteristics) | High statistical probability over macro horizons |
| Timeframe Manifestation | 1-minute, 5-minute, 15-minute charts | 4-Hour, Daily, and Weekly charts |
| Transaction Impact | Generates churn and high broker fee drag | Generates multi-hundred-pip trend capture |
| Best Analytical Tool | Volume Delta, Order Flow Footprint | Fundamental Analysis, Daily Moving Averages |
The Mathematics of the Signal-to-Noise Ratio (SNR)
In quantitative finance, an asset’s directional efficiency is quantified using Perry Kaufman’s Efficiency Ratio (ER), which serves as a standardized proxy for the Signal-to-Noise Ratio:
$$\text{Efficiency Ratio (ER)} = \frac{|\text{Net Directional Price Change}|}{\text{Total Accumulated Path Volatility}} = \frac{|P_t - P_{t-n}|}{\sum_{i=1}^{n} |P_{t-i+1} - P_{t-i}|}$$
Where:
- The numerator represents the Signal (the absolute net displacement from period $t-n$ to $t$).
- The denominator represents the Noise (the sum of all individual absolute price bars traveled across the $n$ periods).
Interpreting the Metric:
- $\text{ER} \to 1.0$ (High Signal / Low Noise): Price is moving in a clean, vertical, uninhibited trend with virtually zero retracement. Trend-following algorithms maximize allocation.
- $\text{ER} \to 0.0$ (High Noise / Low Signal): Price is oscillating wildly back and forth with massive volatility but making zero net progress. Trend-following systems suffer severe whipsaws; mean-reversion algorithms perform best.
Practical Application: Filtering Noise via Higher-Timeframe Confluence
Consider an active retail forex trader observing an apparent bearish breakdown on EUR/USD.
- The 5-Minute Noise Trap:
- On a 5-minute chart, price suddenly breaks below horizontal support at 1.0820, printing three large red candles down to 1.0805.
- An amateur trader interprets this as a definitive breakdown, enters an aggressive short position at 1.0807, and places a tight 12-pip stop-loss at 1.0819.
- The Daily Signal Reality:
- The trader switches to the Daily (D1) chart.
- The daily chart reveals that 1.0805 is the rising 50-day Simple Moving Average (SMA) inside a powerful multi-week macro uptrend driven by European Central Bank hawkishness.
- The 5-minute drop was mere market noise—a temporary liquidity probe triggered by a London bank filling a corporate import order.
- The Resolution: Within 20 minutes, institutional buyers step in at the 50-day SMA; EUR/USD reverses violently back to 1.0860. The 5-minute short seller is stopped out at a complete loss, while the higher-timeframe trader who filtered the noise enters long at structural support.
Tactical Rules to Minimize the Cost of Market Noise
- Anchor Analysis on Daily Charts: Conduct top-down analysis starting on Daily and 4-Hour charts to identify structural trends and key price levels before executing on intraday charts.
- Use Line Charts for Pattern Recognition: Switching from Japanese candlesticks to a closing-price Line Chart filters out erratic wick noise, allowing you to see true structural support and resistance levels.
- Widen Stop-Losses Beyond Intraday Noise Bands: Never place stop-losses inside the average noise band of an asset. Calculate the Average True Range (ATR) on the daily chart and place stops beyond normal random distribution tails.
Frequently Asked Questions (FAQ)
Can market noise be predicted?
No. Individual noise events (such as a 10-pip erratic spike on a 1-minute chart) are mathematically indistinguishable from a random walk and cannot be consistently predicted. However, quantitative market makers model the statistical distribution of noise to capture bid-ask spreads.
Why do higher timeframes have less noise?
Higher timeframes (like Daily and Weekly charts) aggregate thousands of individual transactions over full trading sessions. Transitory emotional trades, micro-rebates, and small order-flow imbalances cancel each other out, leaving only the net consensus of institutional and commercial capital.
What is the best indicator for smoothing out market noise?
Exponential Moving Averages (such as the 21 EMA or 50 EMA) and Heikin-Ashi candlesticks are among the most effective visual tools for smoothing out erratic price noise and highlighting the underlying trend direction.
Ready to trade forex?
Open a free demo account with a regulated broker. Practice with virtual funds before risking real money.