Negative or Bearish Divergence
A negative or bearish divergence occurs when an asset's market price reaches a higher high while a momentum oscillator (such as RSI or MACD) forms a lower high, indicating underlying buyer exhaustion and warning of an impending downward reversal.
What Is a Negative or Bearish Divergence?
In financial technical analysis, a negative divergence (universally referred to as a bearish divergence) is an analytical condition that occurs when the market price of a currency pair, equity, or commodity prints a higher high on the price chart, but the underlying momentum indicator fails to confirm that strength, instead printing a lower high.
This mathematical disagreement between price action and momentum reveals a critical market truth: while visual prices continue to push higher, the internal velocity and buying volume driving the advance are rapidly decelerating. Like an automobile accelerating up a steep hill while the engine loses revolutions per minute (RPM), a negative divergence warns institutional and retail traders that an established uptrend has become fragile, overextended, and vulnerable to an imminent downward trend reversal or deep corrective consolidation.
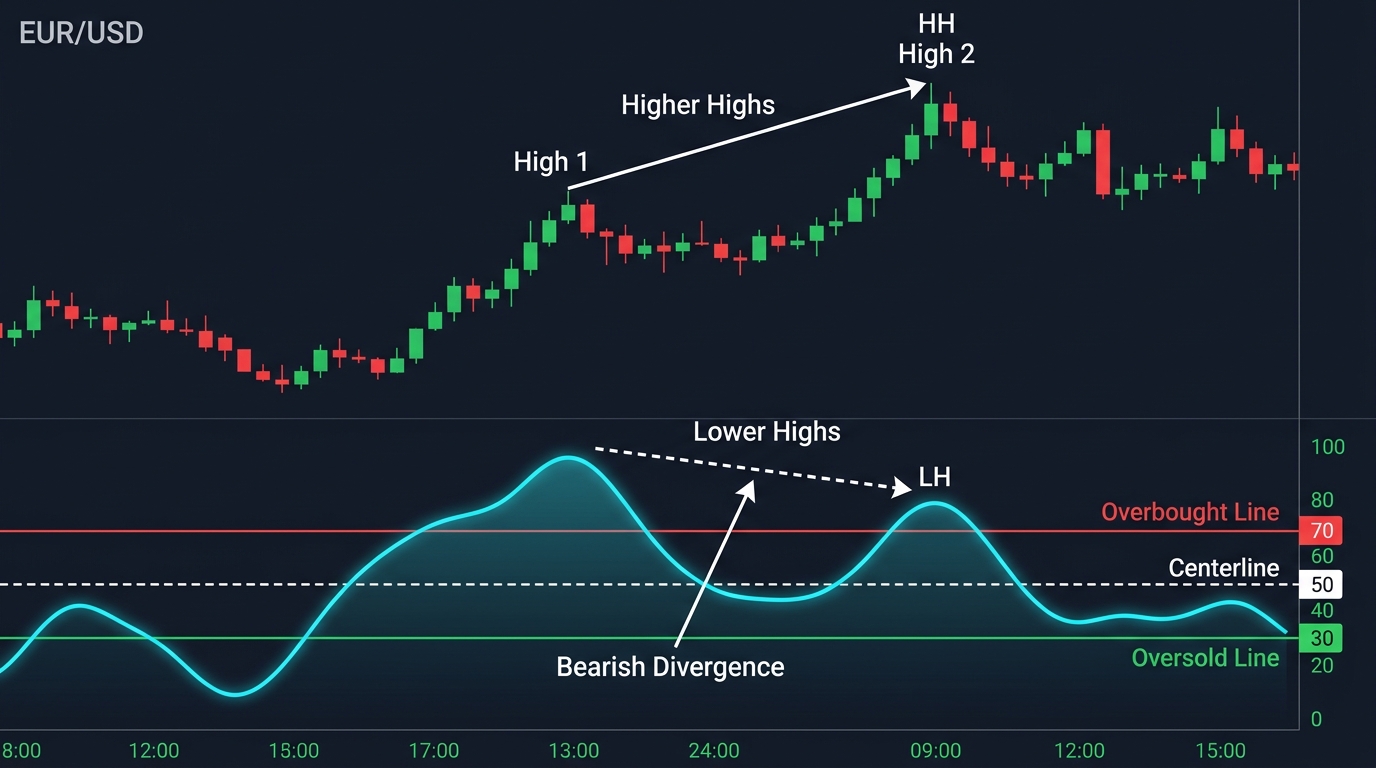
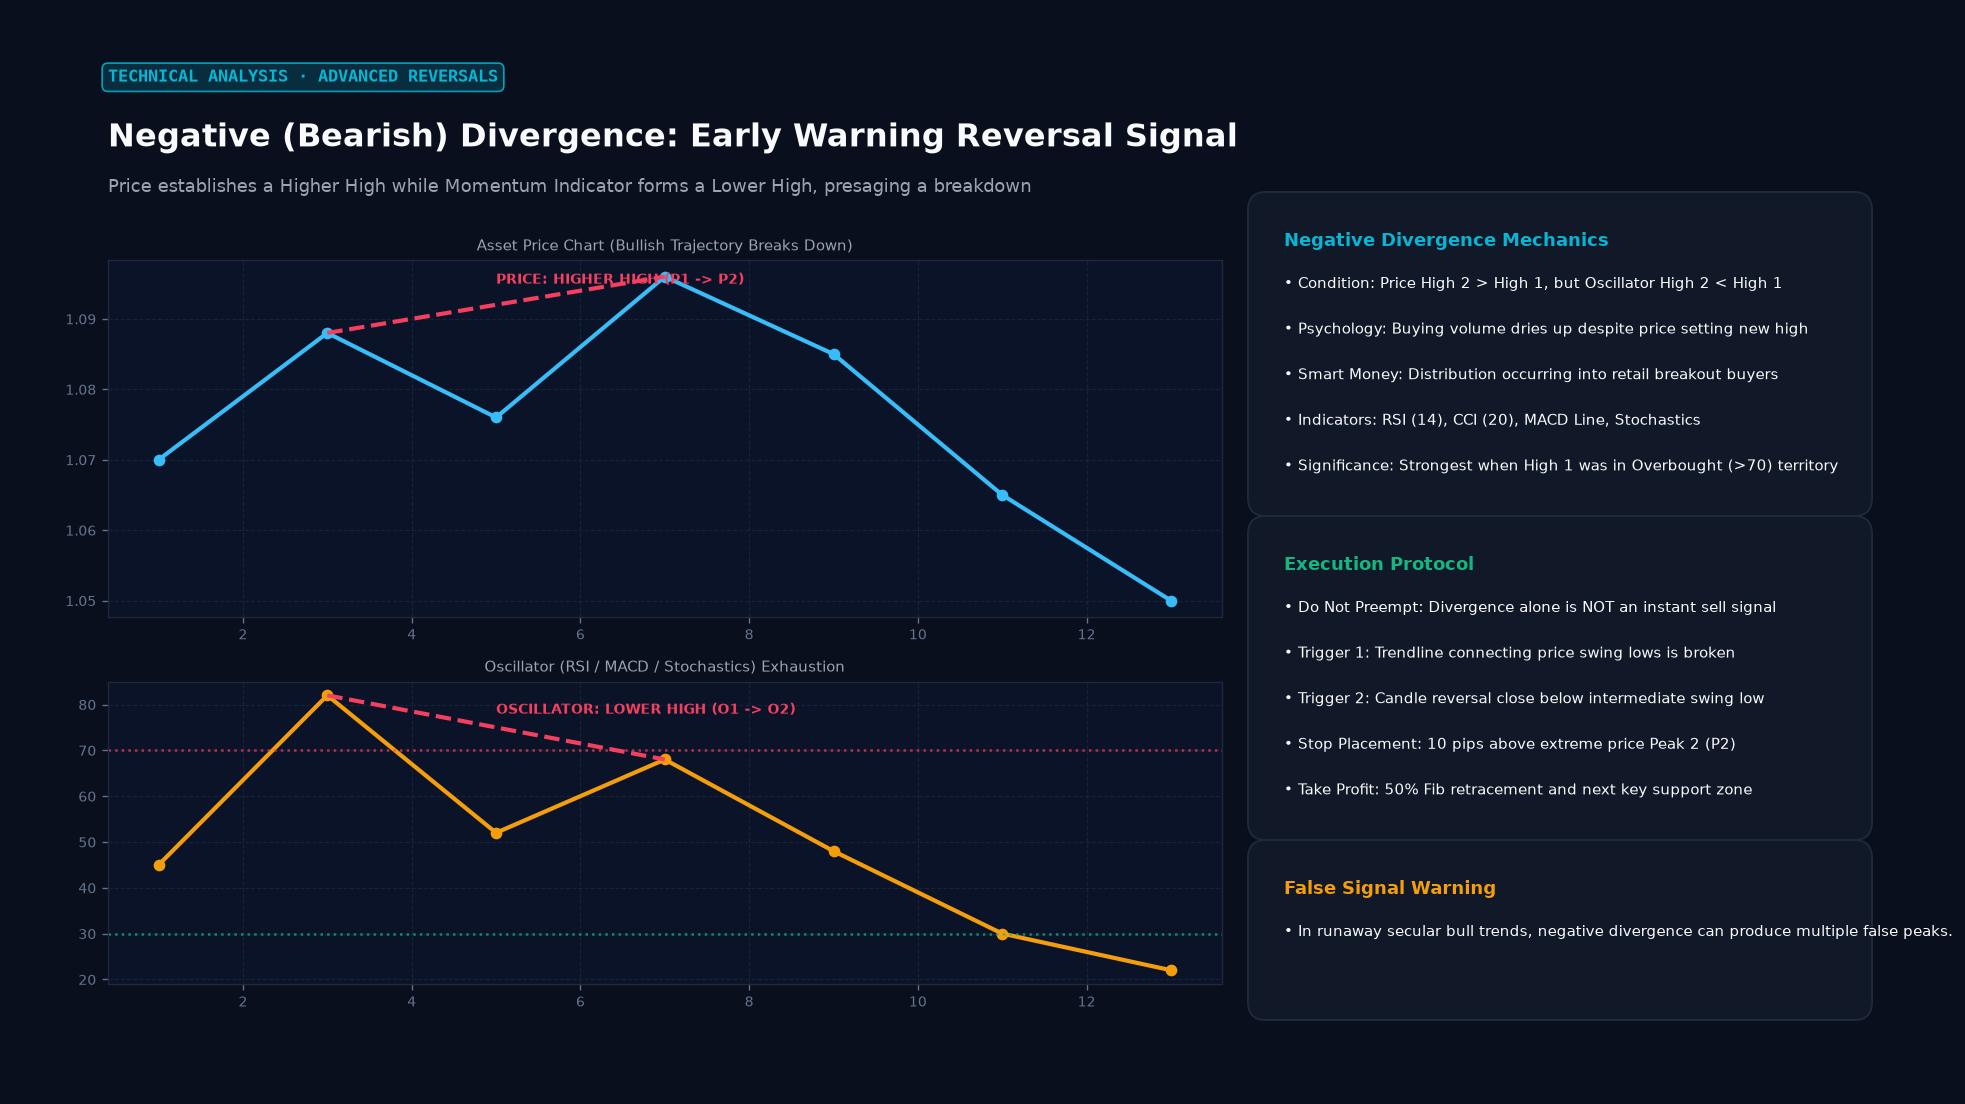 Figure: Price establishes a Higher High while Momentum Indicator forms a Lower High, presaging a breakdown
Key Takeaways
- Momentum Decoupling: Bearish divergence represents a fundamental breakdown between price movement and momentum velocity, exposing phantom rallies driven by thin liquidity rather than aggressive institutional accumulation.
- Leading Indicator Quality: Divergences are among the few technical setups that provide leading warning signals, often appearing several sessions before price actually confirms a top.
- Regular vs. Hidden Variants: Regular Bearish Divergence signals a structural trend reversal (uptrend to downtrend), while Hidden Bearish Divergence signals trend continuation within a broader macro downtrend.
- Divergence Is Not a Trigger: Divergence alone does not justify an immediate short entry; prices can remain divergent for extended periods in strong secular bull runs. Execution requires technical price-action confirmation (such as a structural support break or bearish reversal candle).
- Multi-Oscillator Confirmation: The pattern is most reliable when confirmed across multiple independent oscillators (e.g., simultaneous divergence on both the RSI and the MACD Histogram).
Comparative Taxonomy: The Divergence Matrix
Understanding the difference between Regular and Hidden divergences is critical for identifying whether a setup represents a counter-trend reversal or a high-probability trend continuation.
| Divergence Type | Price Chart Action | Momentum Oscillator Action | Implied Market Meaning | Strategic Application |
|---|---|---|---|---|
| Regular Bearish Divergence | Higher High (HH) | Lower High (LH) | Bullish momentum exhaustion; market top | Short Reversal Entry (Exit long positions) |
| Hidden Bearish Divergence | Lower High (LH) | Higher High (HH) | Bearish pullback exhaustion in downtrend | Short Continuation Entry (Join broader bear trend) |
| Regular Bullish Divergence | Lower Low (LL) | Higher Low (HL) | Bearish momentum exhaustion; market bottom | Long Reversal Entry (Exit short positions) |
| Hidden Bullish Divergence | Higher Low (HL) | Lower Low (LL) | Bullish pullback exhaustion in uptrend | Long Continuation Entry (Join broader bull trend) |
Primary Momentum Oscillators for Divergence Detection
- Relative Strength Index (RSI - 14 Periods): Evaluates the velocity of price gains versus price losses on a 0–100 scale. A price higher-high occurring while RSI peaks below 70 after a previous peak above 75 creates a classic textbook bearish divergence.
- MACD Histogram: Measures the rate of convergence/divergence between the 12 and 26 EMAs. A contraction in histogram bar heights during a price advance provides the earliest possible mathematical signal of momentum decay.
- Stochastic Oscillator (14, 3, 3): Measures the closing price relative to the high-low range over 14 periods. Fast and highly sensitive, making it ideal for intraday divergence identification on 15-minute and 1-hour charts.
Practical Application: The GBP/USD Institutional Reversal Setup
Consider a professional swing trader analyzing a daily chart on GBP/USD.
- Market Context: Following a prolonged three-month bull market, GBP/USD reaches a resistance ceiling:
- Swing Peak 1: Price touches 1.2800 on May 10; RSI (14) prints an overbought peak of 76.5.
- The Pullback: Price retraces to 1.2650, allowing the RSI to cool down to 52.
- Swing Peak 2: Price surges to a fresh high of 1.2900 on June 1.
- The Divergence: The trader inspects the RSI during the new 1.2900 high:
- Despite price gaining 100 pips over Peak 1, the RSI peaks at only 63.2 (a prominent Lower High).
- Simultaneously, the MACD Histogram prints lower bars.
- Waiting for Execution Confirmation:
- The trader does not short at 1.2900 blindly.
- On June 3, price forms a large Bearish Outside Engulfing Candle, closing firmly back below 1.2820, breaking the short-term upward trendline.
- Order Placement:
- Entry: Short at 1.2810 on the close of the confirmation candle.
- Stop-Loss: Placed at 1.2925 (25 pips above the swing high; 115 pips risk).
- Target: Prior structural daily support at 1.2450 (360 pips profit target).
- Outcome: The bearish divergence fulfills its potential; GBP/USD drops over 400 pips over the subsequent three weeks, delivering a profitable 3.1:1 reward-to-risk ratio.
Critical Traps and False Divergence Pitfalls
- The “Strong Trend” Steamroller: In parabolic macroeconomic trends (such as a currency rallying on aggressive surprise interest rate hikes), a bearish divergence can form and fail repeatedly. Shorting a runaway bull market solely based on an oscillator lower high can lead to multiple consecutive stopped-out trades.
- Timeframe Fragility: Bearish divergences on 1-minute or 5-minute charts represent fleeting market noise that is routinely overridden by higher-timeframe order flow. Divergences carry the highest statistical predictive accuracy on 4-Hour (H4), Daily (D1), and Weekly (W1) timeframes.
Frequently Asked Questions (FAQ)
What is the difference between regular and hidden bearish divergence?
A Regular Bearish Divergence forms when price makes a Higher High while the oscillator makes a Lower High, indicating that an uptrend is reversing downward. A Hidden Bearish Divergence forms when price makes a Lower High while the oscillator makes a Higher High, indicating that a corrective rally inside a larger downtrend has ended and the downtrend is continuing.
How do I know when a bearish divergence has failed?
A bearish divergence setup is invalidated if the momentum oscillator pushes above its prior high, or if price breaks convincingly above the swing high with accelerating volume, indicating that a fresh wave of institutional buying has entered the market.
Which indicator is best for spotting bearish divergence?
The Relative Strength Index (RSI) with a 14-period setting is the most widely respected benchmark indicator for spotting price divergences. Many institutional technicians pair it with the MACD Histogram to cross-verify momentum deceleration.
Ready to trade forex?
Open a free demo account with a regulated broker. Practice with virtual funds before risking real money.