Technical Trader
A financial market participant who formulates trading decisions and manages risk primarily through the analysis of historical price action, volume profiles, mathematical indicators, and chart patterns, operating on the premise that all market information is discounted in the price.
What Is a Technical Trader?
A technical trader is an investor, speculator, or algorithmic operator whose decision-making framework is rooted in technical analysis. Rather than examining financial statements, corporate balance sheets, central bank interest rate forecasts, or macroeconomic GDP reports, a technical trader evaluates historical market data—predominantly price movements and trading volume—to identify recurring probabilistic patterns, trend direction, and high-asymmetry risk-reward setups.
The technical trader operates on a foundational premise established over a century ago by Charles Dow: the market price reflects and discounts all known information. Because every macroeconomic reality, corporate secret, political event, and human emotion (greed and fear) must ultimately be filtered into an actual buy or sell order in the order book, technical traders believe that studying the price chart itself provides the purest, most immediate representation of true supply and demand.
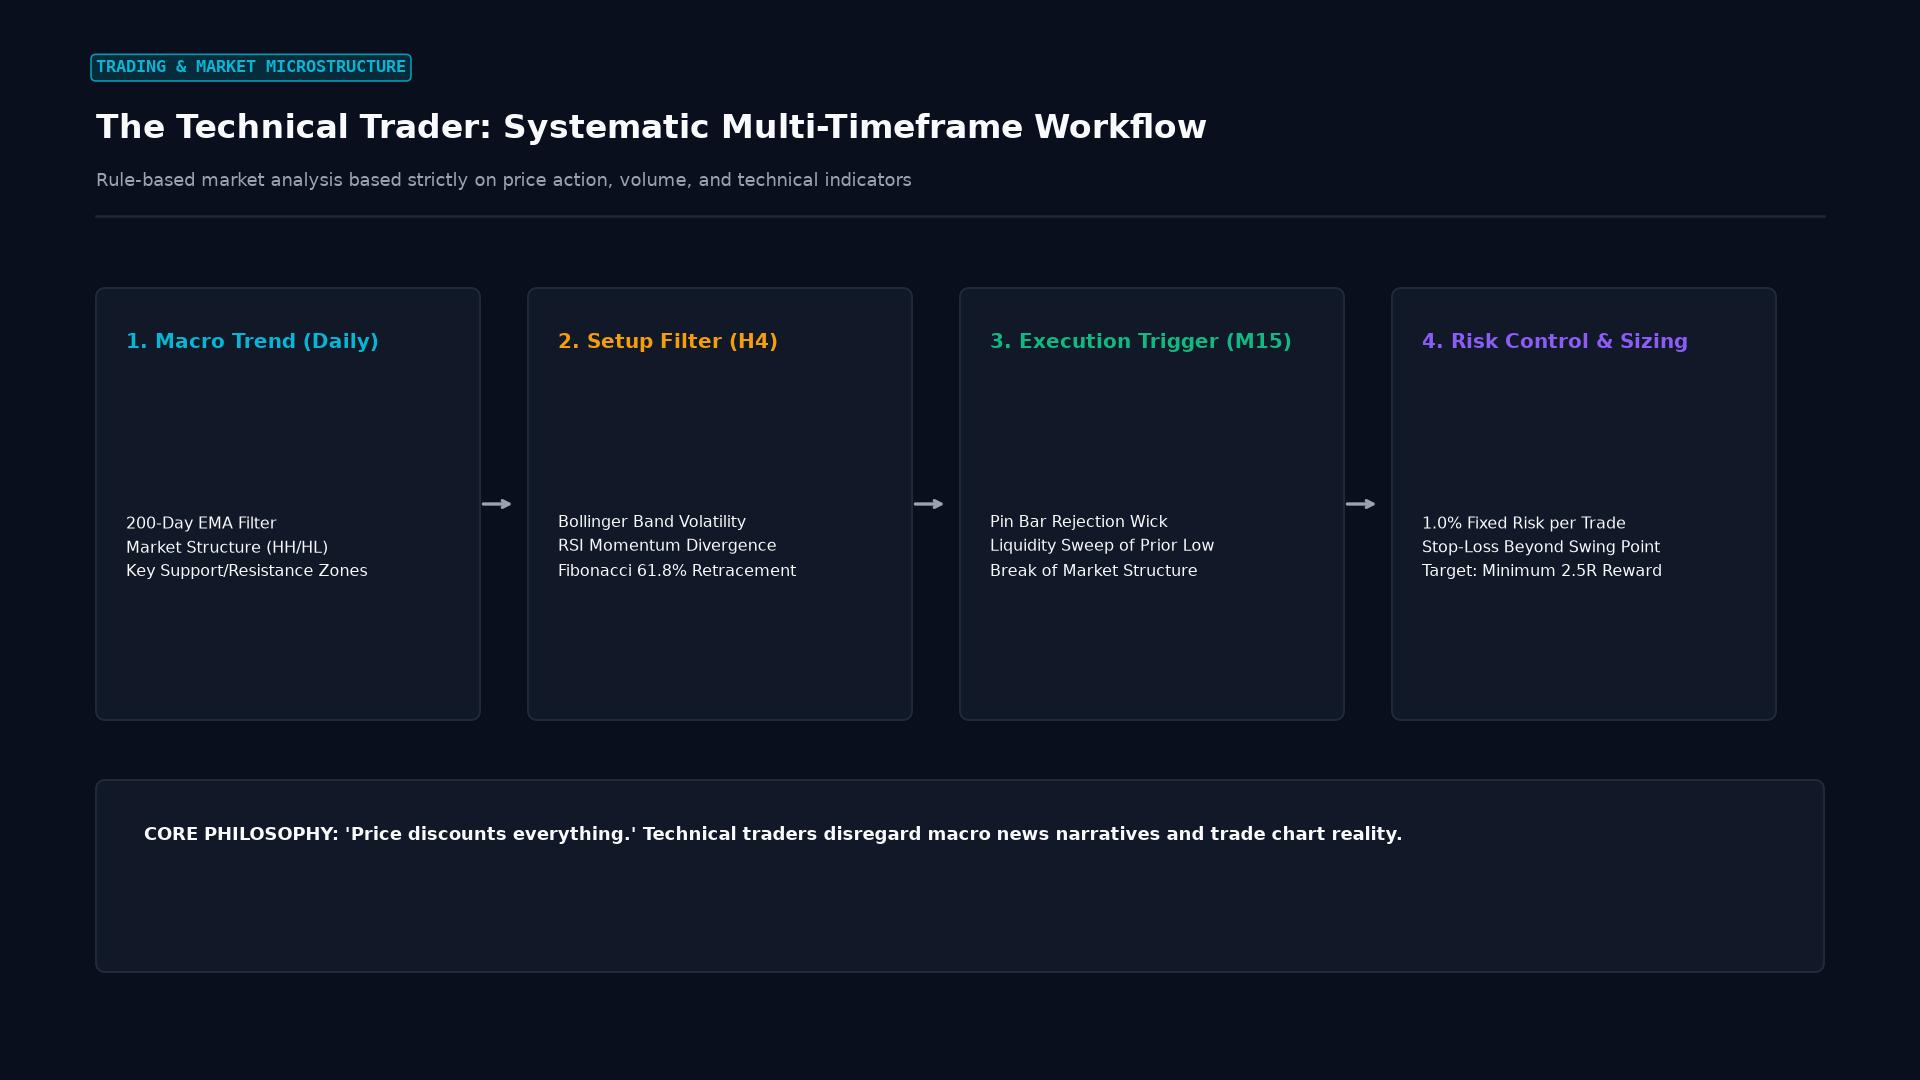 Figure: Systematic chart workflow: daily macro trend filtering, H4 momentum divergence setup, M15 price action entry, and strict 1% risk rules.
The Three Axioms Governing Technical Trading
Every technical trading methodology—from discretionary day trading to multi-million-dollar institutional trend-following programs—is founded upon three core axioms:
1. Market Action Discounts Everything
Technical traders assert that an asset’s current price encapsulates all available public and private information, including corporate earnings, geopolitical risks, macroeconomic policy, and investor psychology. Therefore, attempting to dissect fundamental data is redundant; all that matters is how market participants react to that data on the price tape.
2. Prices Move in Trends
Under the physical principle of inertia, once an uptrend or downtrend is established, the probability of price continuation is mathematically higher than the probability of an immediate reversal. Technical traders deploy trend-following tools to capture the meat of these sustained momentum phases.
3. History Repeats Itself (Fractal Market Psychology)
Human psychological reactions to financial gain and financial pain are immutable. Because collective human fear and euphoria do not change over centuries, chart formations (such as head-and-shoulders, triangles, and double bottoms) manifest repeatedly across all timeframes, from 1-minute tick charts to multi-decade monthly charts.
Technical Trader vs. Fundamental Trader vs. Quantitative Trader
| Dimension | Technical Trader | Fundamental Trader | Quantitative Trader (Quant) |
|---|---|---|---|
| Primary Data Source | Historical price action, volume, candlestick geometry | Financial statements, economic indicators (CPI, GDP, NFP), interest rates | Mathematical datasets, order book microstructure, alternative data |
| Analytical Lens | Chart patterns, oscillators, market structure | Discounted cash flow (DCF), intrinsic value, macroeconomic cycles | Statistical regression, machine learning, high-frequency algorithms |
| Typical Time Horizon | Seconds to several weeks (Intraday to swing) | Months to decades (Long-term investing) | Microseconds to several months |
| Core Objective | Capture directional price momentum and volatility | Exploit discrepancies between price and intrinsic fair value | Exploit mathematical inefficiencies and statistical arbitrage |
| Risk Control Mechanism | Pre-set technical stop-loss orders anchored to chart levels | Portfolio rebalancing, hedging, valuation margin of safety | Real-time Value-at-Risk (VaR) limits, dynamic delta-neutral hedging |
The Archetypes of Modern Technical Traders
Within modern trading desks, technical practitioners specialize across four primary disciplines:
- Price Action and Market Structure Specialists: Discretionary chartists who strip all secondary indicators from their screens, analyzing raw candlestick dynamics, swing highs and lows, institutional liquidity pools, and order blocks (often popularized under Smart Money Concepts or Wyckoff methodologies).
- Classical Pattern Chartists: Practitioners who trade geometry-based formations, identifying continuation and reversal formations including symmetrical triangles, flags, pennants, and double tops.
- Statistical Indicator Strategists: Traders who deploy mathematical indicators—such as the 200-day Simple Moving Average, Bollinger Bands, and the Average True Range (ATR)—to establish systematic, rule-based entry and exit thresholds.
- Systematic Algorithmic Quants: Programmers who convert technical rules into executable code (MQL5, Python, C++), deploying automated trading bots to eliminate human emotional bias and execute trades with microsecond precision.
Real-World Institutional Case Study: Paul Tudor Jones and the 1987 Stock Market Crash
One of the most famous demonstrations of the superiority of technical analysis during market turning points occurred in October 1987, led by legendary hedge fund manager Paul Tudor Jones and his quantitative strategist Peter Borish:
       1987 CRASH: TECHNICAL ANALOG VS. FUNDAMENTAL COMPLACENCY

 Fundamental Consensus (October 1987):
 - Wall Street fundamental analysts maintained strong "Buy" ratings.
 - Corporate earnings were healthy; U.S. GDP growth appeared robust.
 - Fundamentalists argued that a severe stock market crash was economically impossible.

 Paul Tudor Jones Technical Analysis:
 - Borish and Jones overlaid the 1987 technical price chart with the 1929 market crash analog.
 - Technical indicators revealed extreme momentum exhaustion, parabolic blow-off,
   and structural breakdowns below the 200-day moving average.
 - When technical market structure collapsed, Jones aggressively shorted S&P futures.

 The Climax:
 - On "Black Monday" (October 19, 1987), the Dow collapsed 22.6% in a single day.
 - While fundamental funds were wiped out, Tudor Investment Corp captured an
   astonishing 62% return for the month, earning over $100 million in pure profit.
Common Pitfalls: The Traps of the Technical Trader
While technical analysis provides immense power, undisciplined practitioners frequently succumb to specific cognitive and structural errors:
- “Analysis Paralysis” (Indicator Overload): Cluttering a chart with ten conflicting indicators (e.g., three moving averages, RSI, Stochastic, MACD, and Ichimoku Cloud). When indicators provide contradictory signals, the trader becomes paralyzed and misses high-probability setups.
- Curve-Fitting (Over-Optimization): In algorithmic trading, endlessly tweaking indicator parameters to fit historical past data perfectly. While the backtest looks flawless, the model fails catastrophically when deployed into live, unpredictable forward markets.
- Ignoring Tier-1 Macro Calendar Events: Blindly taking a technical breakout signal seconds before the release of the U.S. Non-Farm Payrolls or an FOMC interest rate decision. Macro liquidity voids can instantly blow through technical support levels regardless of chart beauty.
Frequently Asked Questions
Can a technical trader be successful without ever looking at the news?
Many pure technical and algorithmic trend-following funds (such as Dunn Capital or Renaissance Technologies) operate successfully with zero regard for daily news headlines. However, professional discretionary technical traders almost universally monitor the economic calendar to avoid placing tight orders immediately ahead of binary, high-slippage volatility events.
What is a realistic win rate for a professional technical trader?
Most retail traders falsely believe that professionals achieve an 80% to 90% win rate. In reality, elite institutional technical traders and trend followers standardly maintain a win rate of 40% to 55%. Their profitability is generated not through high win rates, but through strict asymmetric risk-to-reward ratios (cutting losses short at $1R$ while allowing winning trends to run to $3R$, $5R$, or $10R$).
Which charting timeframe is best for technical trading?
There is no single “best” timeframe because technical price patterns are fractal (they function identically across all time scales). However, higher timeframes (4-hour, daily, and weekly charts) carry significantly higher reliability because they aggregate massive institutional capital commitments and filter out the high-frequency “noise” that plagues 1-minute and 5-minute charts.
Ready to trade forex?
Open a free demo account with a regulated broker. Practice with virtual funds before risking real money.