Technical Analysis
Technical analysis is the study of historical price action and volume data to forecast future price movements. It operates on three core assumptions: market prices discount all available information, prices move in trends, and history tends to repeat itself through identifiable patterns. It is the dominant methodology among short- to medium-term forex traders.
The Core Philosophy
Technical analysis has a simple proposition: everything you need to know about a market is already reflected in its price. Economic reports, central bank policies, geopolitical events, trader positioning, market sentiment — all of it gets expressed through the one thing you can observe directly: price movement and volume.
If that premise holds, then studying the chart of past prices reveals patterns that can guide decisions about future prices. This is why a committed technical analyst needs no economic calendar, no news feed, no earnings reports — the chart tells the whole story.
Whether the premise holds is genuinely debated. Academic efficient market theory suggests price already reflects all known information, making patterns random noise. Practitioners counter that markets are moved by human psychology, which is predictably irrational and therefore patterned. The debate continues. The practical reality: technical analysis works consistently enough that major institutional trading desks use it, which itself creates the self-fulfilling element that gives many patterns their power.
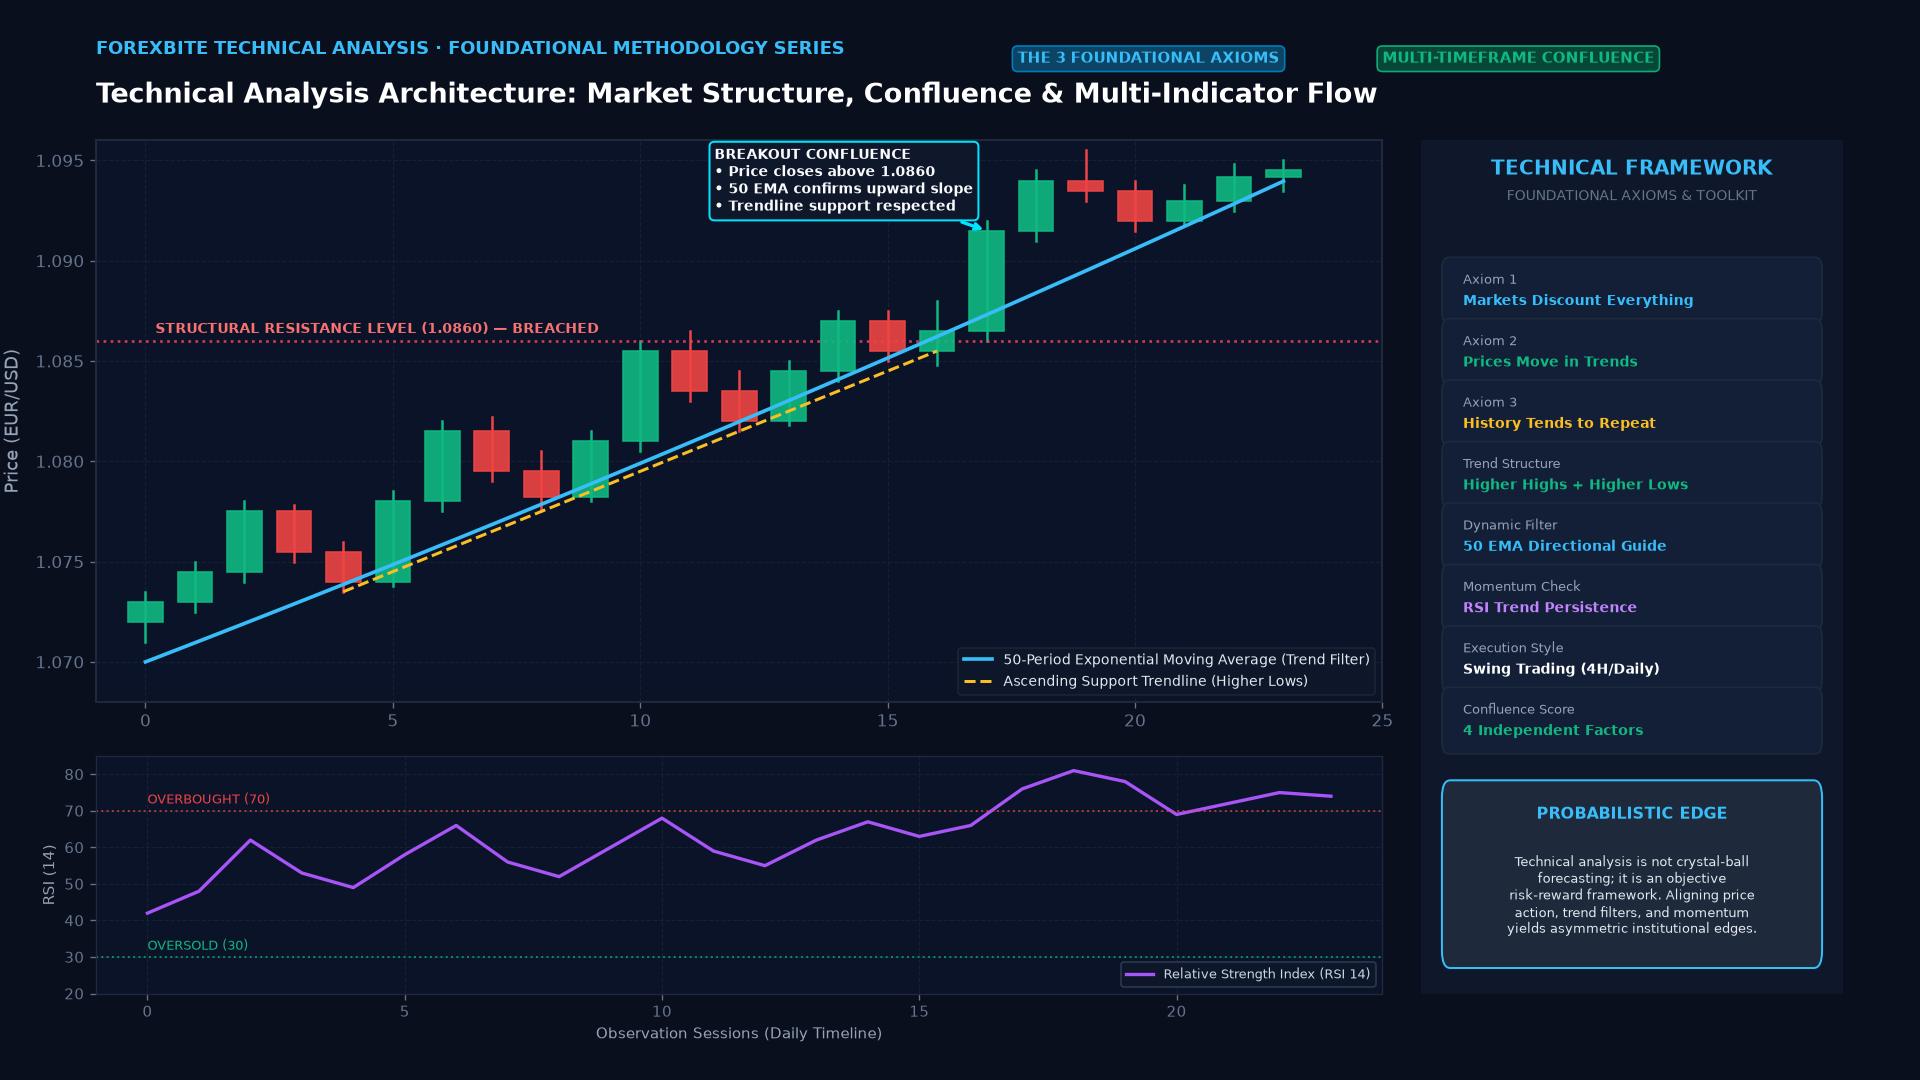
The Three Foundational Principles
1. Markets Discount Everything Every piece of public information — and a meaningful amount of private information through front-running and positioning — is already baked into the current price. Technical analysts therefore don’t need to analyze what news means for a currency; they only need to analyze what price is doing.
2. Prices Move in Trends Markets don’t move randomly. They establish directional biases that persist over time — trending upward, downward, or sideways. Identifying the trend early and trading in its direction is the highest-probability approach available to a market participant.
3. History Repeats Market patterns recur because human psychology remains consistent. The same fear and greed dynamics that created a Head and Shoulders pattern in EUR/USD in 2008 create recognizable variations of the same pattern today. Studying historical price action provides a repertoire of patterns with known statistical outcomes.
The Toolkit of Technical Analysis
Technical analysis encompasses several distinct but complementary approaches:
Chart Patterns: Geometric formations — Head and Shoulders, double tops/bottoms, triangles, flags, wedges — that describe the battle between buyers and sellers and project likely outcomes when one side wins.
Technical Indicators: Mathematical functions applied to price data — Moving Averages, RSI, MACD, Bollinger Bands, Stochastic Oscillator — that provide standardized, quantifiable measures of trend direction, momentum, volatility, and overbought/oversold conditions.
Price Action: The study of candlestick formations and raw price behavior without indicators. Practitioners believe the simplest, most honest information about market intent comes from studying exactly how price is moving — which candles are forming, where they’re forming, and what that implies about participant behavior at that moment.
Volume Analysis: Examining whether price moves are accompanied by conviction (high volume) or lack participation (low volume). Volume-light moves are less reliable; volume-heavy moves at key levels carry more weight.
Support and Resistance: Identifying price zones where supply and demand concentrate, creating predictable turning points or breakout opportunities.
Timeframe Selection and Its Implications
Technical analysis applies across all timeframes — from 1-second tick charts to monthly charts spanning decades. The timeframe you choose fundamentally shapes the strategies available and the outcomes you can expect.
Scalping (1M–5M charts): High frequency, tight targets (5–20 pips), requires lightning execution. Transaction costs (spread) are proportionally large relative to targets. Viable only at brokers with very low spreads.
Day trading (15M–1H charts): Positions opened and closed within a session. Requires sustained attention during trading hours. Avoids overnight/weekend gap risk.
Swing trading (4H–Daily charts): Positions held days to weeks. More compatible with employment and lifestyle constraints. Spread costs are proportionally small relative to targets (50–200 pips). Widely considered the most accessible style for part-time traders.
Position trading (Weekly–Monthly charts): Long-term structural trades held weeks to months. More influenced by fundamentals. Requires patience and ability to tolerate large drawdowns without panic.
The Multi-Timeframe Approach
Most professional technical traders don’t analyze in a single timeframe. They use a top-down approach:
- Higher timeframe (daily/weekly): Identify the primary trend direction and major support/resistance levels
- Intermediate timeframe (4H): Identify the setup — the specific pattern or configuration that creates the trade opportunity
- Entry timeframe (1H/15M): Refine the entry, place stop-loss with precision
A setup on the 1H chart that aligns with the trend on the daily chart and enters at a major weekly support level has three layers of confluence — and statistically higher win rates than any single-timeframe signal.
Key Takeaways
- Technical analysis studies historical price and volume data to forecast future movements
- Three principles: markets discount all information, prices trend, history repeats
- Major tools: chart patterns, indicators, price action, volume analysis, support/resistance
- Timeframe selection determines which strategies are viable
- Multi-timeframe analysis creates higher-conviction setups through confluence
FAQ
Is technical analysis self-fulfilling? Partly, yes — and that’s not a weakness. When millions of traders watch the same RSI level or the same Fibonacci retracement, their collective reaction creates the market effect. The pattern’s validity doesn’t depend on whether it “should” work mathematically; it works because participants make it work through their behavior.
Can technical and fundamental analysis be combined? Absolutely. Many of the most effective trading frameworks use fundamentals to establish directional bias (which way does the macro picture favor?) and technicals to optimize entry (where is the lowest-risk entry point for that bias?). The two approaches complement rather than compete with each other.
Ready to trade forex?
Open a free demo account with a regulated broker. Practice with virtual funds before risking real money.