Historical Volatility
Historical volatility (HV), also termed realized volatility, is a statistical metric that measures the dispersion of an asset's past price fluctuations over a specific timeframe, calculated as the annualized standard deviation of logarithmic price returns.
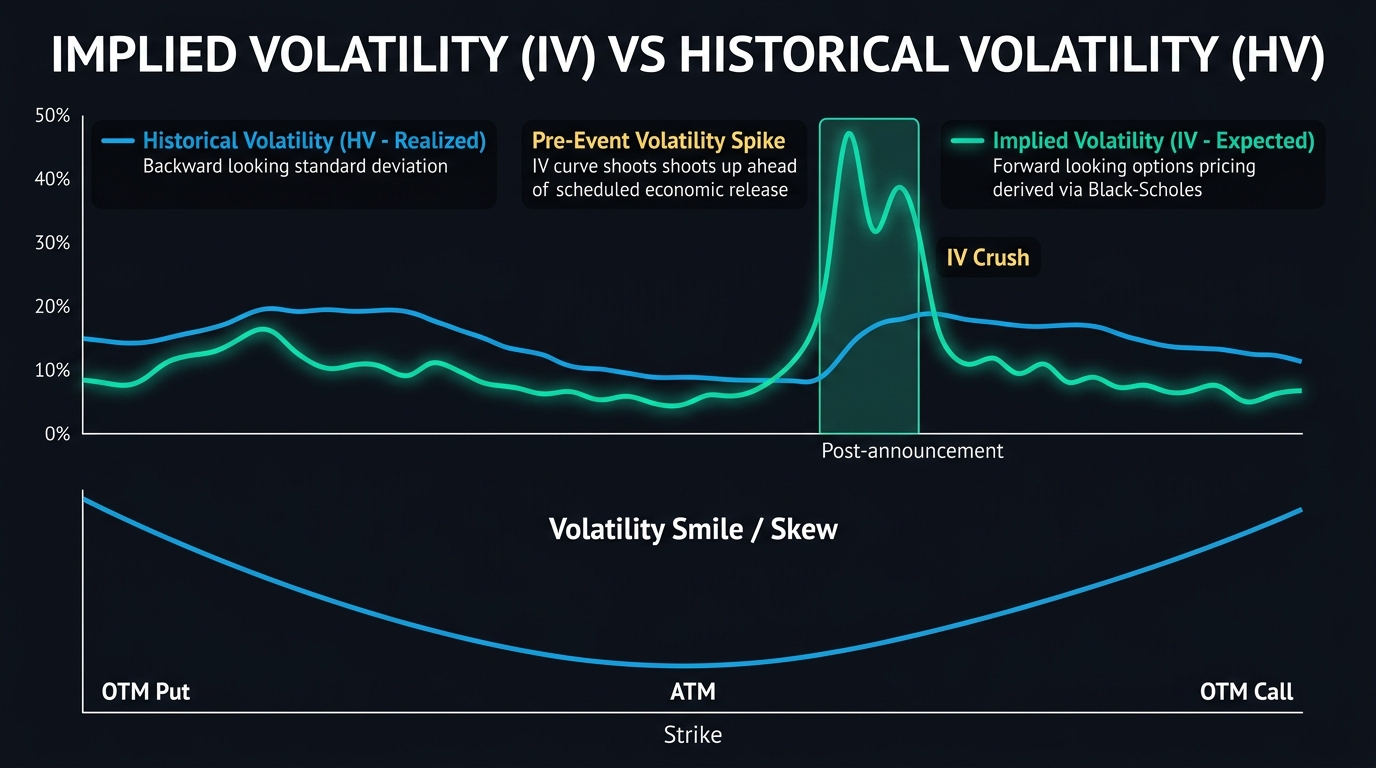
What Is Historical Volatility?
Historical volatility (HV)—frequently referred to in quantitative finance as realized volatility—is a backward-looking statistical indicator that measures how widely an asset’s price has fluctuated in the past. Unlike subjective chart interpretations, historical volatility provides an objective mathematical gauge of price dispersion, capturing the velocity and magnitude of price swings over a predetermined lookback period.
In foreign exchange markets, historical volatility is expressed as an annualized percentage. An exchange rate with an annualized historical volatility of 8% (such as EUR/USD during stable market regimes) fluctuates within a relatively predictable corridor. In contrast, an emerging market currency or cryptocurrency exhibiting historical volatility above 30% indicates severe day-to-day price turbulence.
+-------------------------------------------------------------------------+
|                  HISTORICAL VOLATILITY (REALIZED PAST)                  |
|                                                                         |
|  Lookback Window: Past 30 Trading Days                                  |
|  Price Trajectory: Daily log returns measured against average return    |
|  Output: Annualized Standard Deviation (e.g., 7.4% Annual HV)           |
|                                                                         |
|  Low HV (< 6%)   ===> Range-bound consolidation; breakout imminent      |
|  High HV (> 14%) ===> Aggressive macro trend; large pip swings          |
+-------------------------------------------------------------------------+
The Mathematical Calculation of Historical Volatility
Calculating historical volatility requires a four-step statistical process using logarithmic price returns:
Step 1: Compute Daily Logarithmic Returns
Rather than calculating simple percentage changes, quantitative analysts compute continuously compounded logarithmic returns to ensure statistical symmetry:
$$R_t = \ln\left(\frac{P_t}{P_{t-1}}\right)$$
Where:
- $P_t$ = Closing spot price on day $t$
- $P_{t-1}$ = Closing spot price on the preceding day $t-1$
Step 2: Calculate the Mean Daily Return
Determine the average daily logarithmic return over $N$ trading periods:
$$\bar{R} = \frac{1}{N} \sum_{t=1}^N R_t$$
Step 3: Calculate the Sample Standard Deviation
Measure the dispersion of individual daily returns around the mean return:
$$s = \sqrt{\frac{1}{N - 1} \sum_{t=1}^N (R_t - \bar{R})^2}$$
Step 4: Annualize the Standard Deviation
Because daily standard deviation numbers are small decimals (e.g., 0.0048), analysts scale the result to an annualized percentage by multiplying by the square root of the number of trading days in a year (conventionally 252 trading days for equities and currencies):
$$\text{HV} = s \times \sqrt{252} \times 100%$$
For 24/7 markets like cryptocurrencies, the annualization factor is $\sqrt{365}$.
Historical Volatility vs. Implied Volatility
Understanding the dichotomy between historical and implied volatility is foundational for options pricing and macro currency trading:
| Feature | Historical Volatility (HV) | Implied Volatility (IV) |
|---|---|---|
| Perspective | Backward-looking (what actually occurred) | Forward-looking (market’s future expectation) |
| Source of Data | Historical daily closing price action | Current market prices of traded options |
| Calculation Method | Pure statistical standard deviation formula | Derived inversely via the Black-Scholes model |
| Trading Role | Benchmarks current asset turbulence | Determines whether options are cheap or expensive |
| Typical Relationship | Tends to trade lower than IV (insurance discount) | Typically trades at a premium to HV (VRP) |
The spread between the two metrics is known as the Volatility Risk Premium (VRP). Because option sellers demand compensation for absorbing catastrophic black-swan tail risk, implied volatility is historically higher than realized historical volatility approximately 85% of the time.
Practical Trading Applications in Forex
Currency traders utilize historical volatility indicators to optimize risk management and trade timing:
1. The Volatility Squeeze (Volatility Cycles)
Financial markets naturally transition from periods of high volatility to low volatility, and vice versa. When historical volatility compresses to multi-year percentiles (visualized on charts via narrowing Bollinger Bands or contracting Keltner Channels), it indicates market participants are coiling into a tight equilibrium. Traders prepare for explosive breakout moves, as compressed volatility is the precursor to massive directional expansion.
Volatility Cycle Progression
------------------------------------------------------------------------
Quiet Range (Low HV) --> Coiling Squeeze --> Violent Breakout (HV Surges)
2. Dynamic Position Sizing
Fixed lot sizing (e.g., trading 1.0 standard lot on every trade) is a common retail flaw. If a trader trades 1 lot on GBP/JPY when historical volatility is 18%, their risk exposure is double compared to when GBP/JPY volatility is 9%. Professional risk models adjust trade volume inversely to historical volatility:
- When HV spikes, reduce lot sizes to keep dollar risk constant.
- When HV contracts, allow larger lot sizes within the same tight pip stop-loss parameters.
Key Takeaways
- Historical volatility is the annualized standard deviation of past logarithmic price returns.
- Standard calculation windows typically span 20, 30, or 90 trading days annualized by $\sqrt{252}$.
- HV measures past price action, whereas Implied Volatility (IV) reflects the market’s forward-looking pricing of risk in options contracts.
- Extremely low historical volatility precedes violent directional breakouts (volatility expansion).
- Quantifying realized volatility enables traders to adjust position sizes dynamically to maintain uniform account risk.
Frequently Asked Questions
What is a normal historical volatility range for major forex pairs?
Major pairs like EUR/USD, USD/JPY, and USD/CHF typically exhibit annualized historical volatility between 6% and 10%. During acute global macro crises (such as the 2008 Lehman collapse or March 2020 pandemic), historical volatility on majors can spike above 18% to 22%.
How does Historical Volatility differ from Average True Range (ATR)?
HV is a percentage-based statistical dispersion metric (standard deviation) normalized across assets and annualized. Average True Range (ATR) is an absolute pip-based measure that includes opening price gaps and high-low ranges, showing the raw average price movement per candle.
How do option traders exploit the difference between HV and IV?
When Implied Volatility is significantly higher than Historical Volatility (an inflated Volatility Risk Premium), options sellers write call and put spreads to capture decaying premium. When IV drops significantly below realized HV, option buyers enter straddles expecting options to be underpriced.
Ready to trade forex?
Open a free demo account with a regulated broker. Practice with virtual funds before risking real money.