Implied Volatility
Implied volatility (IV) is a forward-looking metric reflecting the financial market's expectation of an underlying asset's future price volatility, calculated inversely from prevailing option premiums using pricing models like Black-Scholes.
What Is Implied Volatility?
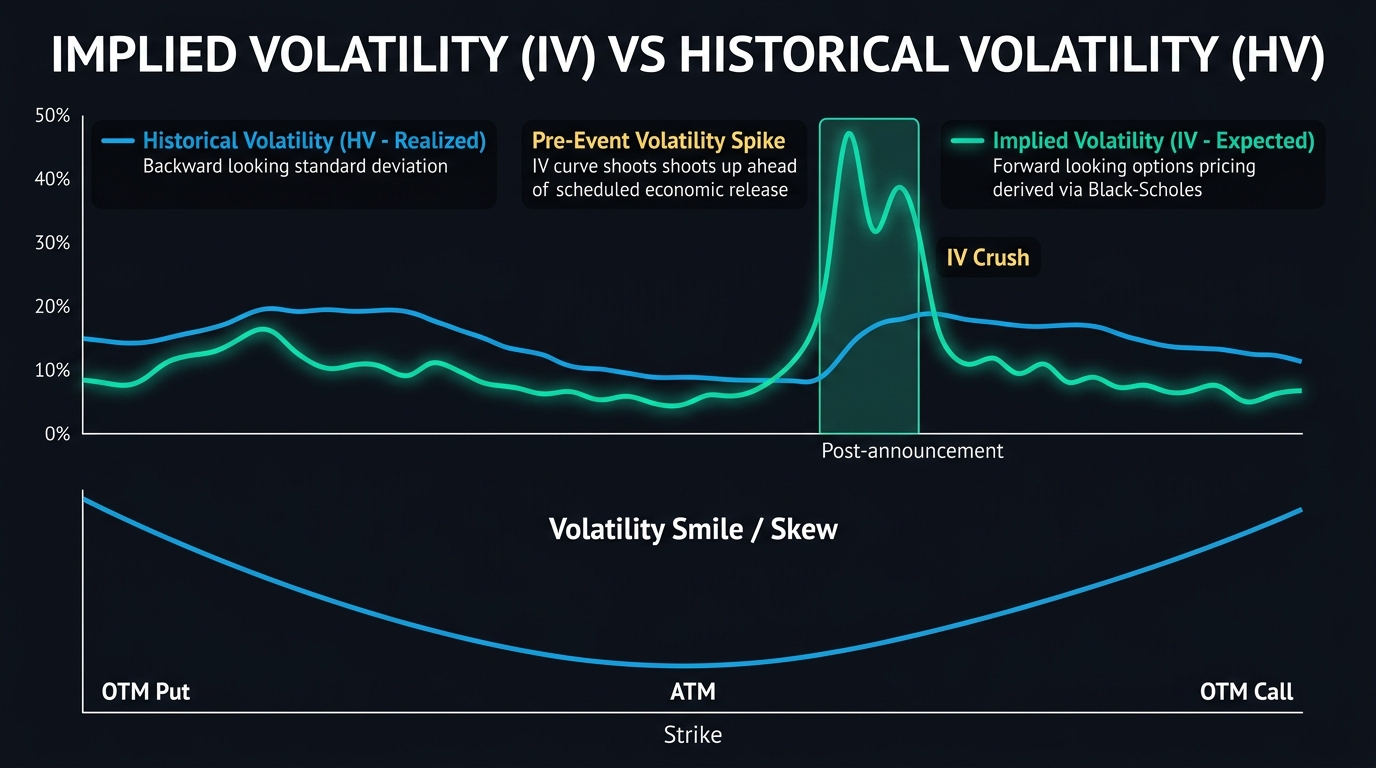
Implied volatility (IV) is a forward-looking quantitative metric that captures the financial market’s collective consensus regarding the magnitude of future price fluctuations for an underlying asset. Unlike historical volatility, which measures what has already transpired in historical price data, implied volatility reflects how much volatility market participants are actively pricing into traded option contracts.
In the foreign exchange market, implied volatility is expressed as an annualized standard deviation percentage (e.g., a 1-month EUR/USD IV of 8.5%). When economic uncertainty, geopolitical friction, or high-impact central bank announcements loom, demand for options hedging spikes. Because option sellers require higher compensation to take on unknown tail risks, option premiums rise. Consequently, the calculated implied volatility expands.
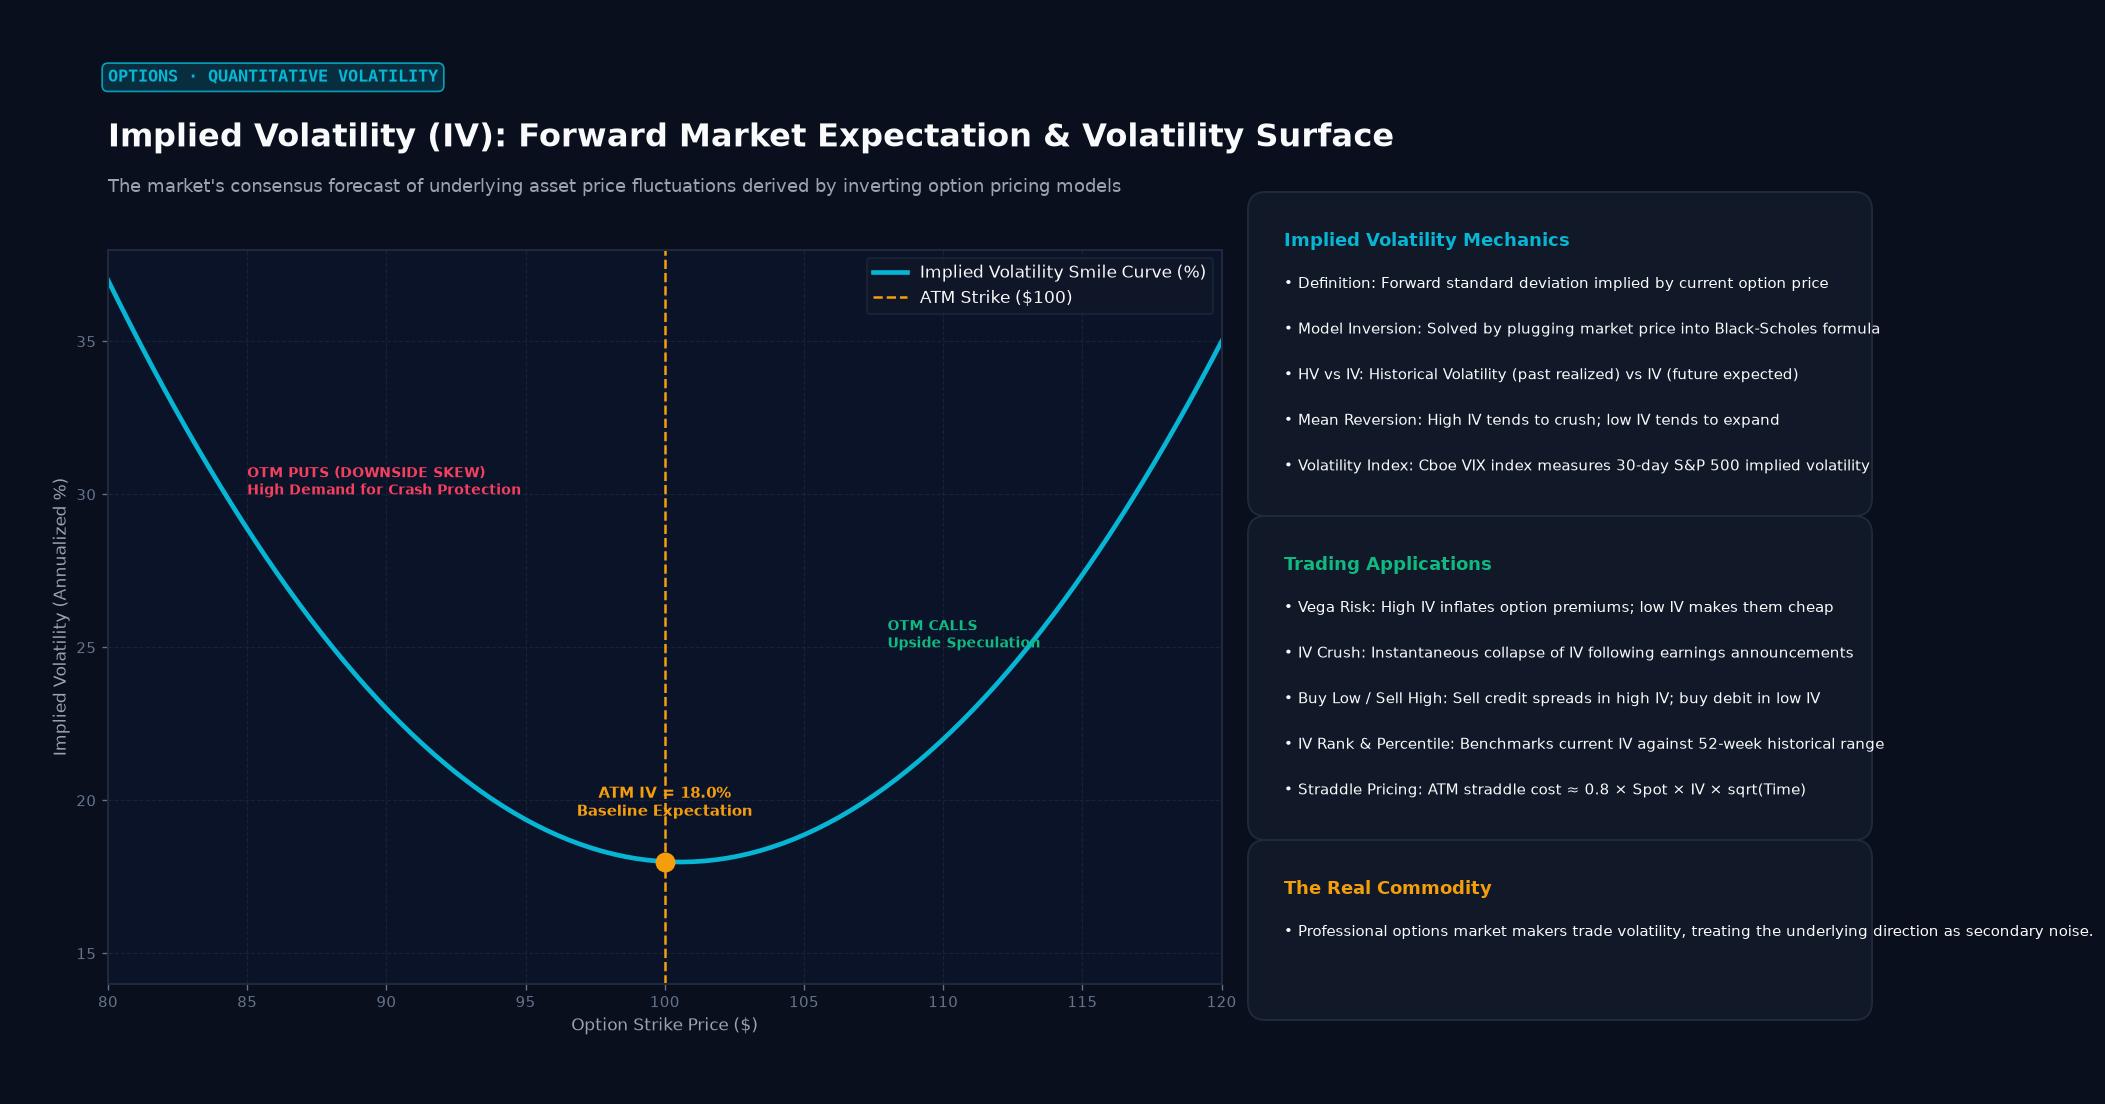 Figure: The market’s consensus forecast of underlying asset price fluctuations derived by inverting option pricing models
Mathematical Derivation: The Inverse Black-Scholes Model
In standard quantitative options pricing models—such as the Black-Scholes-Merton model or the Garman-Kohlhagen model for currency options—an option’s theoretical premium is determined by five observable inputs and one unobservable variable:
$$\text{Option Price} = f(S, K, T, r_d, r_f, \sigma)$$
Where:
- $S$ = Spot exchange rate
- $K$ = Option strike price
- $T$ = Time to expiration
- $r_d$ = Domestic interest rate
- $r_f$ = Foreign interest rate
- $\sigma$ = Volatility (the unknown variable)
Because market prices for traded options are continuously posted on interbank OTC networks and derivative exchanges (such as the CME), quantitative software sets the Black-Scholes formula equal to the live traded market price and uses iterative numerical root-finding algorithms (such as the Newton-Raphson method) to solve for $\sigma$:
$$\text{Solve for } \sigma_{\text{implied}} \text{ such that: } \text{BS}(\sigma_{\text{implied}}) - \text{Price}_{\text{market}} = 0$$
The Volatility Smile and Skew in Currency Options
In theoretical Black-Scholes mathematics, implied volatility is assumed to be constant across all strike prices for a given expiration. In real-world foreign exchange markets, this assumption fails completely, giving rise to the Volatility Smile and Volatility Skew:
Currency Volatility Smile (Implied Volatility vs Strike)
High IV +          \                                /
        |           \                              /
        |            \                            /
        |             \                          /
Low IV  +--------------\------------+-----------/----------------
OTM Put ATM Strike OTM Call- The Volatility Smile: Deep out-of-the-money (OTM) puts and calls trade at significantly higher implied volatilities than at-the-money (ATM) options. This structural “smile” reflects fat-tailed probability distributions (leptokurtosis) in real market returns, pricing in the risk of unexpected geopolitical shocks, flash crashes, or central bank interventions.
- Risk Reversals (The Skew): The difference in implied volatility between a 25-delta out-of-the-money call and a 25-delta out-of-the-money put is known as the Risk Reversal. In currency trading, risk reversals serve as an institutional sentiment barometer:
- If EUR/USD 25-delta put IV is higher than call IV, institutions are paying a premium to hedge against a euro decline (bearish sentiment).
- If call IV commands a premium, the institutional bias is bullish.
Implied Volatility vs. Historical Volatility
| Dimension | Implied Volatility (IV) | Historical Volatility (HV) |
|---|---|---|
| Direction | Forward-looking expectation | Backward-looking realization |
| Derivation | Inversely calculated from option prices | Calculated from past closing price standard deviation |
| Reaction Time | Instantaneous; jumps before news occurs | Gradual; requires price swings to actually unfold |
| Pricing Bias | Typically trades at a premium (VRP) | Reflects the true baseline movement of the asset |
| Utility | Evaluates whether options are cheap or rich | Benchmarks normal asset volatility ranges |
Practical Forex Applications of Implied Volatility
- Anticipating Scheduled Macro Shocks: In the days preceding major economic releases—such as US Non-Farm Payrolls (NFP), Consumer Price Index (CPI) prints, or FOMC rate decisions—short-dated implied volatility spikes. Traders use this expansion to calculate the market’s “expected move” in pips before placing breakout or straddle orders.
- Option Strategy Selection:
- High IV Environments: Option premiums are inflated. Professional desks sell option premium (credit spreads, iron condors) to capture rapid volatility collapse (IV crush) once event risk clears.
- Low IV Environments: Option premiums are depressed. Traders buy long calls, puts, or straddles cheaply, seeking asymmetric payouts on unexpected market expansion.
Key Takeaways
- Implied volatility reflects the market’s forward-looking consensus regarding future price fluctuations.
- It is derived inversely from live traded option prices using the Black-Scholes options pricing model.
- High IV signals that market participants expect severe price turbulence, making options expensive to purchase.
- The Volatility Smile illustrates that out-of-the-money currency options command higher implied volatility due to fat-tailed tail risk.
- Risk Reversals compare call vs. put implied volatility, providing a transparent indicator of institutional market bias.
Frequently Asked Questions
What causes implied volatility to collapse suddenly (IV Crush)?
Immediately after a major binary event concludes—such as a central bank rate announcement or national election—the outcome becomes known. Uncertainty vanishes from the market, causing demand for hedging options to evaporate. Implied volatility plunges instantly, resulting in an “IV crush” that drastically devalues long option premiums.
How is implied volatility converted into an expected daily pip move?
Traders apply the “Rule of 16” (derived from the square root of 252 trading days, $\approx 15.87$). Dividing annualized implied volatility by 16 provides the market’s expected one-standard-deviation daily percentage move. For example, an IV of 16% equates to an expected daily swing of approximately ±1.0%.
Can implied volatility predict which direction a currency will move?
No. Standard implied volatility is non-directional; it measures the anticipated magnitude of price dispersion, not the direction. To gauge directional market bias, traders analyze the 25-Delta Risk Reversal skew between calls and puts.
Ready to trade forex?
Open a free demo account with a regulated broker. Practice with virtual funds before risking real money.