Weekly Charts
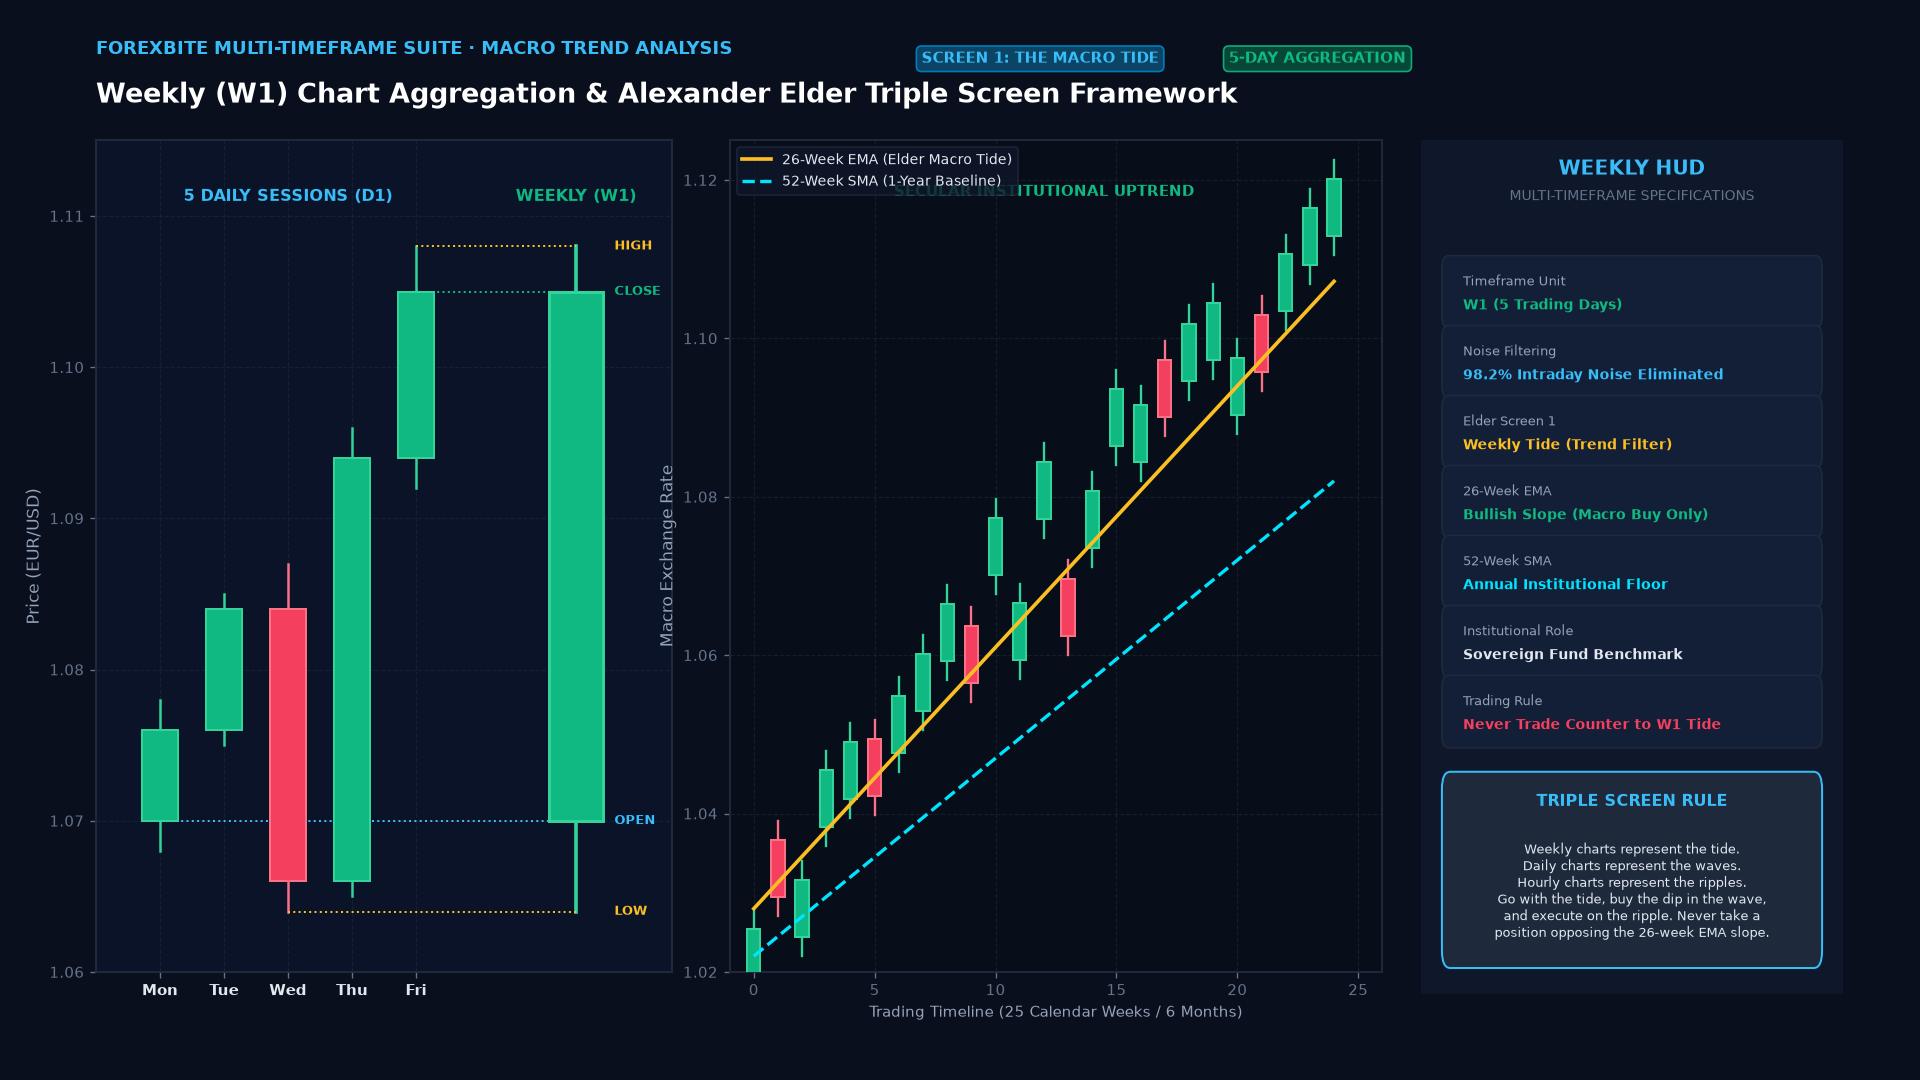
Weekly charts are multi-day technical analysis representations where each candlestick or bar aggregates five consecutive daily trading sessions, providing macro perspective by filtering out short-term market noise.
What Are Weekly Charts?
In technical analysis and professional trading, weekly charts represent price action where each individual bar or candlestick encapsulates the aggregate trading activity of an entire business week (typically Monday open through Friday close).
While retail traders frequently become disoriented by intraday volatility and erratic news-driven spikes on 5-minute or 1-hour charts, institutional portfolio managers and interbank market makers utilize weekly charts as their primary baseline for trend direction, institutional accumulation/distribution phases, and multi-month support and resistance levels.
Technical Mechanics & Multi-Timeframe Synthesis
Weekly charts form the foundation of professional multi-timeframe analysis, such as Alexander Elder’s Triple Screen Trading System:
- Screen 1 (Macro Trend - Weekly Chart): Identifies the secular market tide. If the 26-week exponential moving average (EMA) or weekly MACD histogram is sloping upward, the trader is permitted to take long positions only.
- Screen 2 (Intermediate Wave - Daily Chart): Identifies counter-trend pullbacks using oscillators (such as the daily RSI or stochastic oscillator). A daily pullback into oversold territory provides a low-risk entry aligned with the weekly tide.
- Screen 3 (Execution Ripple - 4-Hour or 1-Hour Chart): Provides precise intraday breakout or limit order execution.
Mathematical Construction of a Weekly Bar
Given daily trading data vectors for sessions $t \in {1, 2, 3, 4, 5}$:
$$O_{\text{week}} = O_1$$
$$H_{\text{week}} = \max\left(H_1, H_2, H_3, H_4, H_5\right)$$
$$L_{\text{week}} = \min\left(L_1, L_2, L_3, L_4, L_5\right)$$
$$C_{\text{week}} = C_5$$
$$\text{Volume}{\text{week}} = \sum{t=1}^{5} \text{Volume}_t$$
Because $C_5$ represents the final Friday closing price, weekly candles reflect the aggregate institutional positioning going into weekend risk, making the weekly close one of the most reliable technical filters against false breakouts.
Comparative Matrix: Timeframe Characteristics
| Feature | Intraday (15M / 1H) | Daily (D1) | Weekly (W1) | Monthly (MN) |
|---|---|---|---|---|
| Market Noise | Severe (high random walk) | Moderate | Low (high signal-to-noise ratio) | Negligible |
| Holding Horizon | Hours to 1 day | Days to weeks | Months to quarters | Multi-year secular trends |
| Support / Resistance | Easily pierced by news | Moderately reliable | Extremely resilient; institutional benchmarks | Long-term macro turning points |
| Execution Frequency | High turnover; high commissions | Moderate | Low; minimal transaction drag | Very rare portfolio rebalancing |
| Indicator Lag | Low lag; prone to whipsaws | Balanced | Higher lag; captures sustained trends | Extensive lag |
Real-World Case Study: The 2014 EUR/USD Macro Trend
In May 2014, the European Central Bank (ECB) signaled that it would introduce negative deposit rates and embark on quantitative easing, while the US Federal Reserve prepared to conclude its asset purchases.
EUR/USD Weekly Chart Breakdown (May 2014 - March 2015):
- May 2014: EUR/USD formed a weekly bearish engulfing candle at 1.3990.
- Daily Charts: Exhibited frequent multi-day violent short squeezes that stopped out intraday trend followers.
- Weekly Chart: Throughout the entire 10-month decline, EUR/USD never closed a single weekly candle above its descending 20-week Exponential Moving Average (EMA).
- March 2015: The pair reached a low of 1.0460, completing a 3,500-pip institutional trend that was cleanly navigated by maintaining short exposure until a weekly candle closed above the 20-week EMA.
Traders who anchored their bias on the weekly timeframe avoided being shaken out by the hundreds of erratic intraday rallies during that historical cycle.
Frequently Asked Questions (FAQ)
Why is the Friday closing price on a weekly chart considered so important?
The Friday closing price (specifically the 17:00 New York foreign exchange close) represents the price at which commercial banks, hedge funds, and institutional market makers are willing to hold risk across the two-day weekend. Holding positions over the weekend exposes institutional desks to geopolitical breaking news and opening gap risk; therefore, strong buying or selling conviction into the Friday close provides genuine institutional confirmation.
How do traders prevent indicator lag when using weekly charts?
Weekly charts naturally suffer from greater indicator lag because each bar requires five full trading days to close. To mitigate this without sacrificing the weekly trend’s clarity, professional traders utilize multi-timeframe synthesis: they use the weekly chart solely to determine the directional bias (long vs. short) and key macro support/resistance zones, while dropping down to daily or 4-hour charts to generate timely entries via local candlestick triggers or momentum divergence.
What are the most effective technical indicators for weekly charts?
The most proven indicators on weekly charts are trend-following moving averages (such as the 20-week EMA and the 50-week and 200-week Simple Moving Averages) to define secular market regimes, along with the weekly Relative Strength Index (14-period RSI) and the Moving Average Convergence Divergence (MACD). Weekly RSI divergences across major cyclical peaks or troughs frequently precede major multi-month macroeconomic turning points.
Ready to trade forex?
Open a free demo account with a regulated broker. Practice with virtual funds before risking real money.