Accumulative Swing Index (ASI)
The Accumulative Swing Index (ASI) is a trend-following momentum oscillator developed by J. Welles Wilder Jr. that aggregates daily Swing Index values across open, high, low, and close prices to identify phantom breakouts and true directional trendline breaks.
What Is the Accumulative Swing Index (ASI)?
The Accumulative Swing Index (ASI) is a technical analysis momentum indicator developed by legendary market technician J. Welles Wilder Jr., first introduced in his landmark 1978 work New Concepts in Technical Trading Systems (which also introduced the Relative Strength Index, Average True Range, and Parabolic SAR).
While most momentum oscillators rely solely on closing prices, the Accumulative Swing Index evaluates the complete relational structure between the current bar’s Open, High, Low, and Close (OHLC) and the prior bar’s Open and Close.
By calculating a daily Swing Index (SI) and plotting its cumulative running total, the ASI acts as a smoothed mathematical proxy for the “real market.” It filters out intraday whipsaws and deceptive spikes, allowing forex and futures traders to validate genuine trendline breakouts and spot institutional trend reversals before they become visible on standard candlestick charts.
                    ACCUMULATIVE SWING INDEX (ASI) BREAKOUT

  PRICE CHART (EUR/USD Daily):
  Price tests resistance but hesitates with false wicks...
  1.0950 |             /\          /\  (Double Top False Wick)
  1.0900 |     /\     /  \  /\    /  \
  1.0850 |-- -/--\---/----\/- \--/----\---------------- Resistance Barrier
  1.0800 |   /    \_/          \/      \

  ASI OSCILLATOR:
  ASI cuts through the noise and breaks out ahead of price!
    +50  |                         / \ (CLEAR BREAKOUT CONFIRMATION!)
      0  |-------------/\---------/---\----------------- ASI Zero Line
    -50  |      /\    /  \  /\   /
         +---------------------------------------------> Time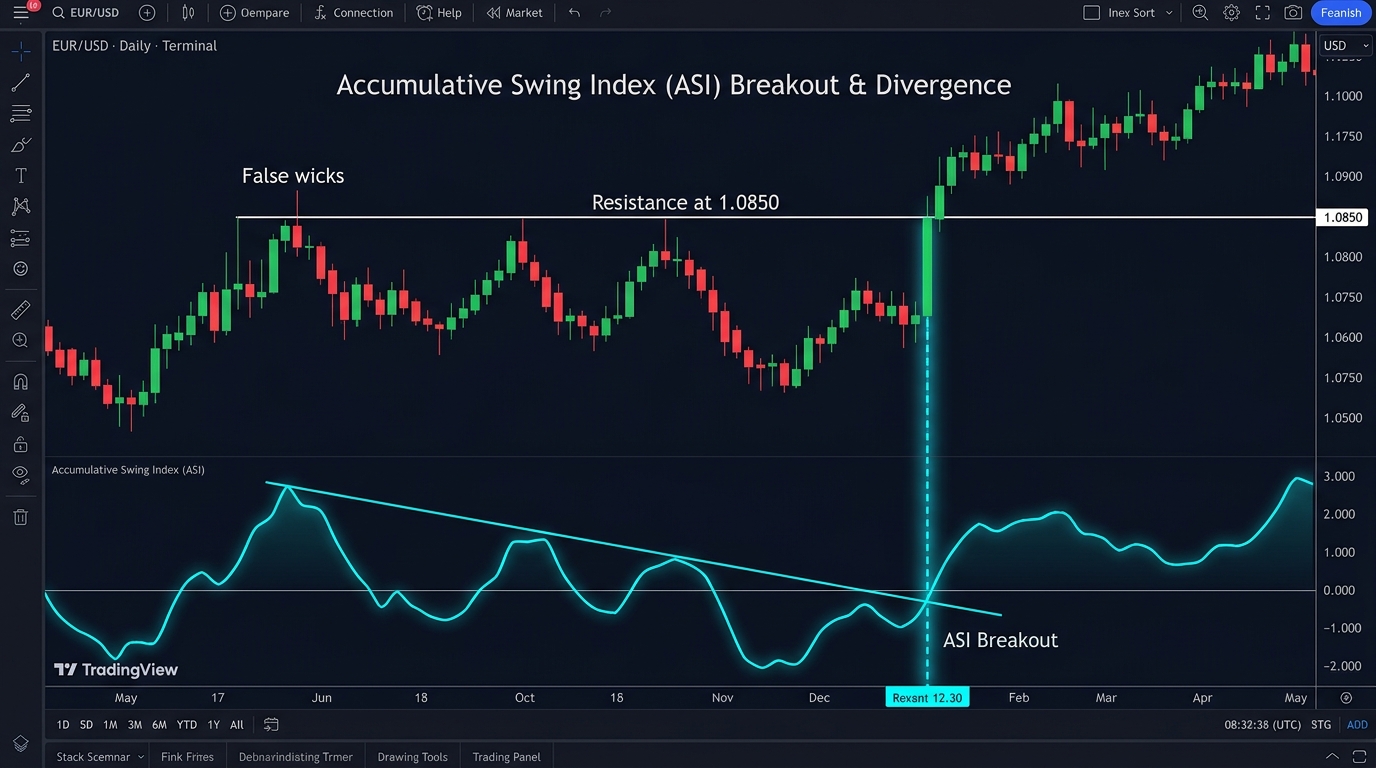
Technical Mechanics & Mathematical Formulation
The Accumulative Swing Index is a cumulative sum of the individual Swing Index (SI) calculated for each trading session:
ASI_Today = ASI_Yesterday + Swing Index (SI)The underlying Swing Index (SI) is calculated through a multi-step formula scaling results between -100 and +100:
SI = 50 × [(C_t - C_(t-1)) + 0.5 × (C_t - O_t) + 0.25 × (C_(t-1) - O_(t-1))] / R × (K / L)Where:
- C_t, O_t, H_t, L_t: Current period Close, Open, High, and Low.
- C_(t-1), O_(t-1): Prior period Close and Open.
- L: The maximum daily limit move for futures (in forex, traders establish an arbitrary volatility factor, such as 300 pips).
- K: The greater of
|H_t - C_(t-1)|or|L_t - C_(t-1)|. - R: A variable parameter determining volatility based on which price spread is largest:
- If
|H_t - C_(t-1)|is largest:R = |H_t - C_(t-1)| - 0.5 × |L_t - C_(t-1)| + 0.25 × |C_(t-1) - O_(t-1)| - If
|L_t - C_(t-1)|is largest:R = |L_t - C_(t-1)| - 0.5 × |H_t - C_(t-1)| + 0.25 × |C_(t-1) - O_(t-1)| - If
|H_t - L_t|is largest:R = |H_t - L_t| + 0.25 × |C_(t-1) - O_(t-1)|
- If
Core Trading Strategies Using the ASI
Traders deploy the Accumulative Swing Index across three primary technical setups:
1. Trendline Breakout Validation
Wilder posited that trendlines drawn directly across the peaks and troughs of the ASI line are significantly more reliable than trendlines drawn across raw candlestick charts:
- When price tests a resistance barrier, traders look at the ASI.
- If the ASI penetrates its corresponding swing high before the price chart breaches resistance, a genuine bullish breakout is imminent.
- If price makes a new high but the ASI fails to clear its previous peak, the move is a deceptive false breakout (bull trap).
2. Phantom Breakout Identification
In volatile currency pairs like GBP/JPY or AUD/NZD, news releases frequently create extended candlestick wicks that poke above resistance levels without institutional follow-through. The ASI calculation dampens these wicks by weighing the closing price and opening relationship, preventing traders from getting trapped in false momentum breakouts.
3. Divergence Signaling
- Bullish Divergence: Price prints lower lows while the ASI forms higher lows, signaling that selling momentum is decelerating and institutional accumulation is occurring.
- Bearish Divergence: Price prints higher highs while the ASI prints lower highs, warning that smart money is distributing into retail buying strength.
Comparative Matrix: ASI vs. RSI vs. On-Balance Volume (OBV)
| Indicator Dimension | Accumulative Swing Index (ASI) | Relative Strength Index (RSI) | On-Balance Volume (OBV) |
|---|---|---|---|
| Data Inputs | Open, High, Low, Close (Current & Prior) | Closing prices exclusively | Closing prices and trading volume |
| Output Type | Cumulative unbounded running total line | Bounded momentum oscillator (0 to 100) | Cumulative running volume line |
| Primary Strength | Validating authentic trendline breaks | Identifying overbought / oversold extremes | Detecting institutional volume accumulation |
| Forex Applicability | Excellent; zero reliance on volume data | Excellent; pure price-based indicator | Poor; spot forex lacks centralized volume |
| Market Creator | J. Welles Wilder Jr. (1978) | J. Welles Wilder Jr. (1978) | Joe Granville (1963) |
Real-World Case Study: GBP/USD Daily Breakout Validation
In July 2024, the GBP/USD currency pair consolidated beneath a multi-month descending resistance trendline at 1.2850. On three separate occasions, intra-day spikes pierced 1.2870 during London morning sessions, only for prices to retreat by the New York close, leaving long upper shadows on daily candles.
Traders monitoring the Accumulative Swing Index drew a parallel descending trendline across the ASI swing highs:
- During the first two price spikes, the ASI remained pinned firmly below its technical resistance line, signaling lack of relational momentum between opening and closing bars.
- On July 10, following positive UK inflation data, GBP/USD opened at 1.2820 and closed near the session high at 1.2865.
- While price had not yet broken the 1.2870 ceiling, the ASI broke decisively above its five-month resistance trendline.
- Institutional traders took long entries upon the ASI breakout with stops beneath the swing low at 1.2780. Over the subsequent ten trading days, GBP/USD surged 240 pips to test 1.3040, validating the predictive lead of the ASI indicator.
Frequently Asked Questions (FAQ)
What value should forex traders use for the “Limit Move” (L) in the ASI formula?
In futures markets, exchanges enforce statutory daily limit moves (such as 30 cents on corn). Because spot forex has no centralized limit moves, traders typically set the Limit Move parameter to a realistic daily maximum volatility threshold for that currency pair (for example, 300 pips for G10 pairs like EUR/USD or 500 pips for exotic crosses).
Can the Accumulative Swing Index be used on intraday timeframes?
While Wilder designed the ASI for daily charts, modern electronic platforms apply the formula to 1-hour and 4-hour timeframes effectively. It is less reliable on 1-minute and 5-minute charts where high-frequency quote noise distorts the relationship between open and close.
Is the ASI a standalone trading system?
No. Wilder cautioned that the ASI should not be traded in isolation. It functions best as a trendline confirmation filter combined with volatility metrics like the Average True Range (ATR) or trend-following tools like the Parabolic SAR and moving average ribbons.
Ready to trade forex?
Open a free demo account with a regulated broker. Practice with virtual funds before risking real money.