Resistance
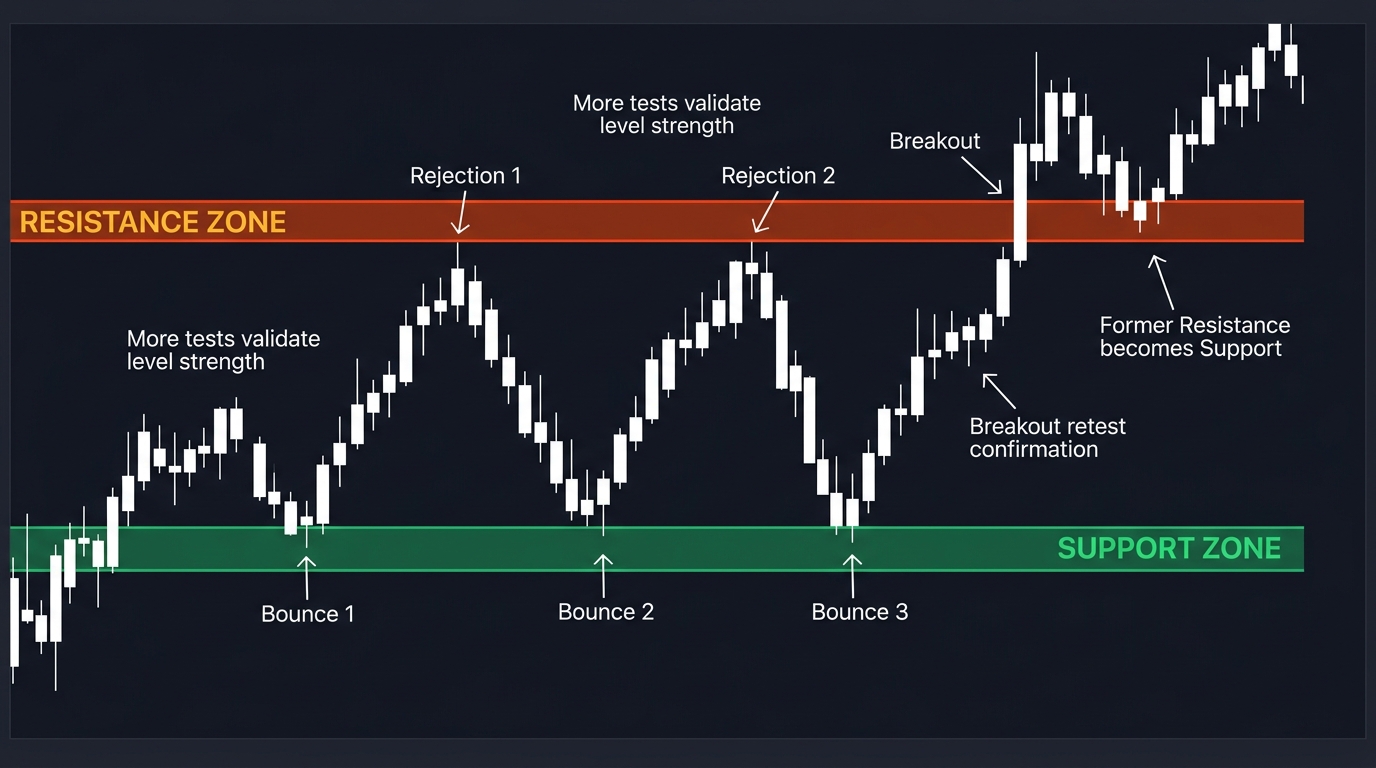
Resistance is a price level or zone on a chart where selling pressure has historically been sufficient to prevent price from rising further. It forms where sellers consistently outnumber buyers at a specific price range, creating a ceiling that price struggles to break through. When resistance is broken convincingly, it often transforms into support — a concept known as role reversal.
Why Resistance Levels Form
Resistance doesn’t appear randomly. It forms because of the collective memory of market participants who traded at those prices previously.
Consider a price level at 1.1000 on EUR/USD that price approached three months ago and reversed. Traders who bought at 1.1000 during that rally are now sitting in breakeven or losing positions after the subsequent decline. When price returns to 1.1000, these buyers finally have a chance to exit — they sell. Their selling adds supply at exactly 1.1000, which reinforces the resistance.
Additionally, traders who profited from the previous rejection of 1.1000 remember that level as a reliable selling opportunity. They position their short entries there on the next approach. This creates a self-reinforcing cycle: the more times a level acts as resistance, the more market participants expect it to act as resistance again, and the more sell orders concentrate there.
Types of Resistance Levels
Horizontal resistance: The most common type — a flat price level that has been tested multiple times from below. Round numbers (1.1000, 1.2000, 150.00 on USD/JPY) attract additional horizontal resistance because of the psychological order concentration at round figures.
Dynamic resistance (declining trend lines): In a downtrend, the falling series of lower highs forms a declining trend line that acts as dynamic resistance. As price approaches the trend line, sellers activate.
Moving average resistance: In a downtrend, the 20 EMA or 50 SMA can act as dynamic resistance. Price rallies to the declining moving average and is rejected — a common pattern in bear markets.
Fibonacci resistance: Fibonacci retracement levels (38.2%, 50%, 61.8%) from a prior swing high to low become resistance targets on counter-trend rallies.
Previous support flipped to resistance: When price breaks below a horizontal support level, that level “flips” — it becomes resistance on subsequent rallies back up to it. The mechanics: traders who bought at support and lost money now have a chance to exit at breakeven when price returns; they sell. This is “role reversal” and creates very reliable resistance.
Trading Resistance
Short entry at resistance:
- Identify a clear resistance level with at least two prior touches
- Wait for price to rally to the level
- Look for a confirming bearish candlestick signal (shooting star, bearish engulfing, pin bar rejection)
- Enter short on the close of the confirming candle, stop above the resistance level (5-15 pip buffer)
- Target: next support level below
The entry timing challenge: Resistance zones, not resistance lines — price often slightly pierces a level before reversing. Setting stops too tight at exactly the resistance price results in being stopped out before the reversal. Allow a buffer zone of 10-20 pips above the level on daily timeframes.
Confluence Resistance
The strongest resistance levels occur where multiple technical factors align:
- A horizontal level that has been tested three or more times
- Coincides with a Fibonacci retracement level
- Aligns with a declining trend line
- Coincides with a major round number
When two or more factors point to the same price level, the concentration of sell orders there is typically higher, and the rejection is more likely to be reliable and sharp.
Key Takeaways
- Resistance forms from collective market memory — traders who bought at highs and want to exit at breakeven, and those who profited from previous rejections
- Types: horizontal (most reliable), dynamic (trend lines, moving averages), Fibonacci, and flipped support
- Trading strategy: enter short after a bearish candlestick signal at resistance, stop above with buffer, target next support
- Allow for a zone (not a precise line) — prices slightly pierce resistance before reversing
- Strongest levels: confluence of multiple resistance factors pointing to the same price area
FAQ
How many times does resistance need to be tested to be “reliable”? Two confirmed tests establish a resistance level. Three tests significantly increase reliability. Each additional test makes the level more established in market memory. However, each test also potentially weakens the level slightly — sellers who planned to sell at resistance have already done so, and there are fewer remaining orders at that level for future tests.
What happens when resistance is tested repeatedly without breaking? Paradoxically, a level that has been tested many times without breaking eventually becomes more likely to break, not less. Every test consumes some of the selling supply at that level. When the accumulated buying pressure exceeds remaining seller supply, the breakout occurs — often suddenly and with significant momentum, as sell-stop orders above the level are triggered in a cascade.
Ready to trade forex?
Open a free demo account with a regulated broker. Practice with virtual funds before risking real money.