Advertising sales ratio
The advertising-to-sales ratio (A/S ratio) is a financial and operational metric that measures marketing expense relative to gross revenue, evaluating commercial expenditure efficiency and capital allocation across consumer and corporate sectors.
What Is the Advertising-to-Sales Ratio?
The advertising-to-sales ratio (A/S ratio) measures promotional expenditure against total sales revenue over a designated financial accounting period. Expressed as a percentage, the metric quantifies how many cents of advertising capital a firm commits to generate each dollar of top-line revenue. Fundamental equity analysts, venture capitalists, and corporate treasury teams inspect this ratio to evaluate marketing productivity, brand defensibility, and pricing power.
A high advertising-to-sales ratio indicates that an enterprise relies heavily on paid acquisition and brand marketing campaigns to defend market share or onboard new users. A low ratio often reflects either superior organic customer retention, word-of-mouth distribution, dominant competitive moats, or an underfunded marketing pipeline vulnerable to rival disruption. Evaluating the ratio requires contextual benchmarking against industry medians, product life cycles, and macroeconomic consumption trends.
       Total Advertising Expenditure
A/S = ─────────────────────────────── × 100
             Total Net Sales
In institutional corporate finance, the metric serves as a foundational input for Customer Acquisition Cost (CAC) and Lifetime Value (LTV) models. When companies scale revenue without expanding their A/S ratio, they demonstrate marketing operating leverage, allowing gross profit gains to flow unimpeded to operating income (EBITDA).
Formula and Analytical Calculation
Calculating the advertising-to-sales ratio requires extracting advertising expenses from Selling, General, and Administrative (SG&A) line items on the income statement, combined with net revenue:
$$\text{Advertising-to-Sales Ratio} = \left( \frac{\text{Total Advertising Expenses}}{\text{Total Net Sales}} \right) \times 100$$
Consider an enterprise software firm generating $250,000,000 in net annual recurring revenue while incurring $32,500,000 in performance marketing, programmatic ad placements, and brand media:
$$\text{A/S Ratio} = \left( \frac{32,500,000}{250,000,000} \right) \times 100 = 13.0%$$
In this case, the enterprise reinvests 13 cents of every dollar collected into promotional activity. If an established competitor produces $800,000,000 in revenue on $48,000,000 of marketing outlay (an A/S ratio of 6.0%), the competitor demonstrates superior brand equity and lower friction in recurring sales conversions.
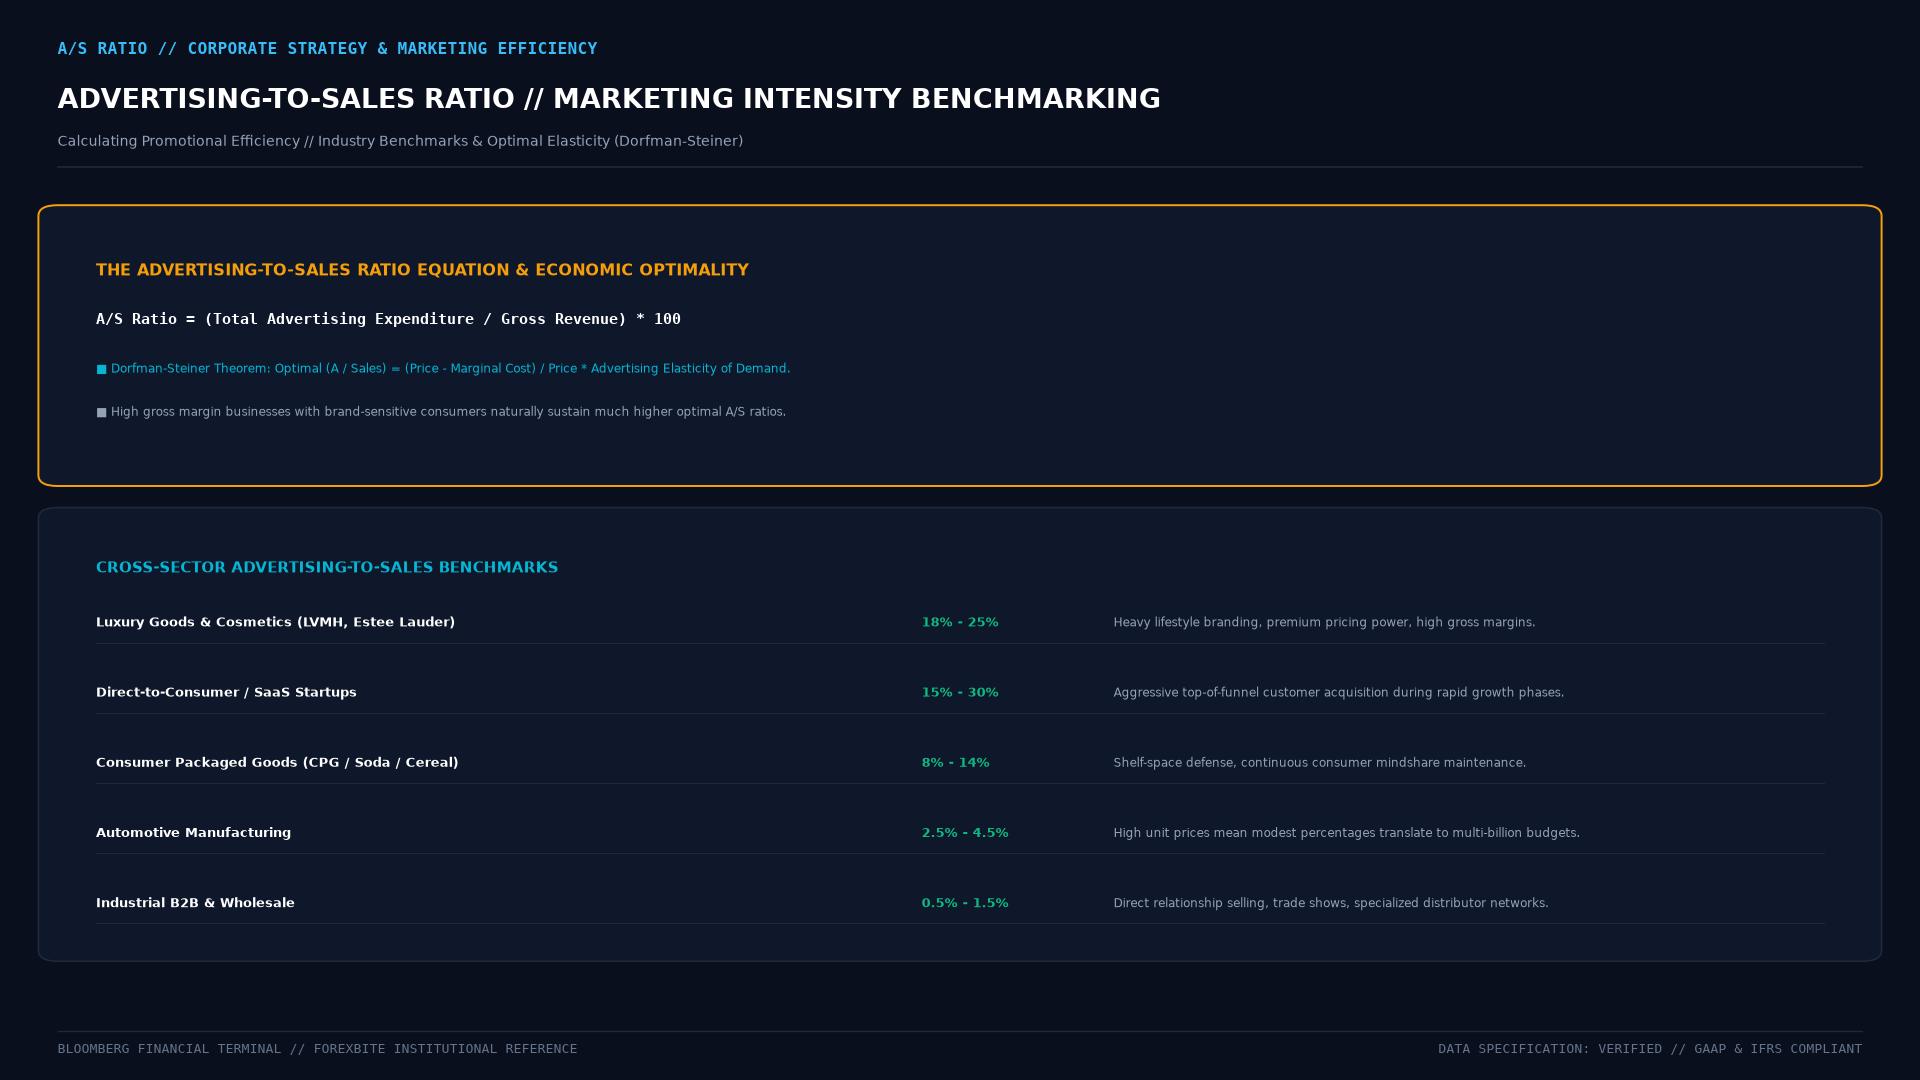 Figure: Advertising-to-Sales (A/S) ratio distribution across global industry sectors alongside Dorfman-Steiner economic theorem modeling the profit-maximizing advertising intensity based on price elasticity of demand.
Sector Benchmarks and Capital Dynamics
Acceptable thresholds for the advertising-to-sales ratio diverge substantially across industry verticals:
| Industry Sector | Typical A/S Range | Economic Drivers |
|---|---|---|
| Consumer Packaged Goods (CPG) | 8.0% to 15.0% | Fierce retail shelf competition and low switching costs |
| Direct-to-Consumer (DTC) E-Commerce | 15.0% to 30.0% | Heavy dependence on digital ad auctions and platform algorithms |
| Enterprise Software (B2B SaaS) | 10.0% to 22.0% | Upfront customer acquisition with long contract horizons |
| Heavy Manufacturing & Industrial | 0.5% to 2.5% | Relationship-driven procurement and multi-year supply tenders |
| Pharmaceuticals (Direct-to-Consumer) | 4.0% to 12.0% | High gross margins subsidizing major broadcast awareness campaigns |
| Automotive Manufacturers | 2.5% to 5.0% | High transaction values coupled with dealer co-op funding structures |
High-margin businesses can absorb elevated promotional ratios because unit economics leave ample room for administrative overhead and net profit. Conversely, low-margin operations such as grocery retail, operating at 1.5% to 3.0% net margins, face immediate insolvency if marketing expenditures drift past 1.0% to 2.0% of sales.
Strategic Implications for Fundamental Equity Valuation
Equity research desks evaluate trends in the advertising-to-sales ratio to assess corporate durability:
- Diminishing Marginal Returns: When advertising expenditure increases at a faster rate than revenue growth, customer acquisition channels have reached saturation. This pattern triggers margin compression.
- Earnings Quality and Expense Management: Underperforming management teams sometimes cut advertising budgets artificially before quarterly earnings calls to disguise weak revenue and hit short-term EPS targets. Forensic analysts scrutinize sudden drops in the A/S ratio that coincide with decelerating sales.
- M&A Synergy Analysis: Corporate acquirers forecast post-merger cost savings by consolidating marketing programs. If an acquiring conglomerate can lower a target’s A/S ratio from 12% to 7% through centralized agency contracts and cross-selling, substantial free cash flow unlocks instantly.
       High Spend / High Growth             High Spend / Low Growth
     ┌─────────────────────────────┬─────────────────────────────┐
     │ Aggressive Scaling Phase    │ Marketing Inefficiency      │
H    │ Rapid market share capture; │ Saturation; rising CAC;     │
i    │ high customer acquisition   │ diminishing returns on ads  │
g    ├─────────────────────────────┼─────────────────────────────┤
h    │ Organic Moat / Market Leader│ Cash Cow / Mature Value     │
     │ Brand loyalty; pricing      │ High cash conversion; low   │
     │ power; low marketing burden │ reinvestment requirement    │
L    └─────────────────────────────┴─────────────────────────────┘
o                  Low                         High
w
                  ◄─── Sales Growth Deceleration ───►
Key Takeaways
- The advertising-to-sales ratio calculates the percentage of net revenue allocated to advertising and promotional activities.
- High ratios are common in digital consumer platforms and software, whereas low ratios characterize industrial manufacturing and wholesale supply.
- Tracking the ratio over consecutive quarters reveals whether a company enjoys operational leverage or suffers from customer acquisition saturation.
- Artificial reductions in marketing spending can temporarily inflate reported operating income while undermining long-term customer pipeline health.
Frequently Asked Questions
What is a healthy advertising-to-sales ratio?
A healthy ratio depends entirely on the operating sector and the company’s life-cycle stage. Early-stage consumer startups frequently run ratios between 20% and 35% to drive brand adoption, while mature industrial manufacturers operate successfully below 2%. A healthy ratio consistently generates positive marginal operating income from each incremental marketing dollar spent.
How does the advertising-to-sales ratio differ from Return on Ad Spend (ROAS)?
ROAS measures the direct revenue produced by a specific advertising campaign divided by that campaign’s specific cost (for example, $5 revenue for every $1 ad spend = 500% ROAS). The advertising-to-sales ratio is a comprehensive macro-financial metric taken from corporate financial statements reflecting total advertising expense as a percentage of company-wide sales.
Why do value investors analyze trends in the A/S ratio?
Value investors inspect the A/S ratio to spot signs of sustainable competitive advantage. Companies that steadily expand their top-line revenues while lowering their advertising-to-sales ratio demonstrate genuine customer loyalty and pricing power, proving that customers purchase because of product quality rather than continuous paid persuasion.
Ready to trade forex?
Open a free demo account with a regulated broker. Practice with virtual funds before risking real money.