AHT
AHT stands for Average Holding Time, a quantitative trading metric measuring the mean duration an investment strategy maintains open market positions between entry execution and final exit.
What Does AHT Stand For in Trading?
In algorithmic trading, quantitative portfolio management, and performance analytics, AHT stands for Average Holding Time. It quantifies the mean duration that a trader, automated execution algorithm, or institutional hedge fund holds an open risk position in a financial instrument between the initial trade entry and the final position liquidation.
Average Holding Time is a foundational structural parameter in financial engineering. It dictates a strategy’s exposure to market liquidity, determines sensitivity to transaction costs and broker commissions, shapes capital turnover velocity, and governs how quickly predictive signals (alpha) decay across time horizons.
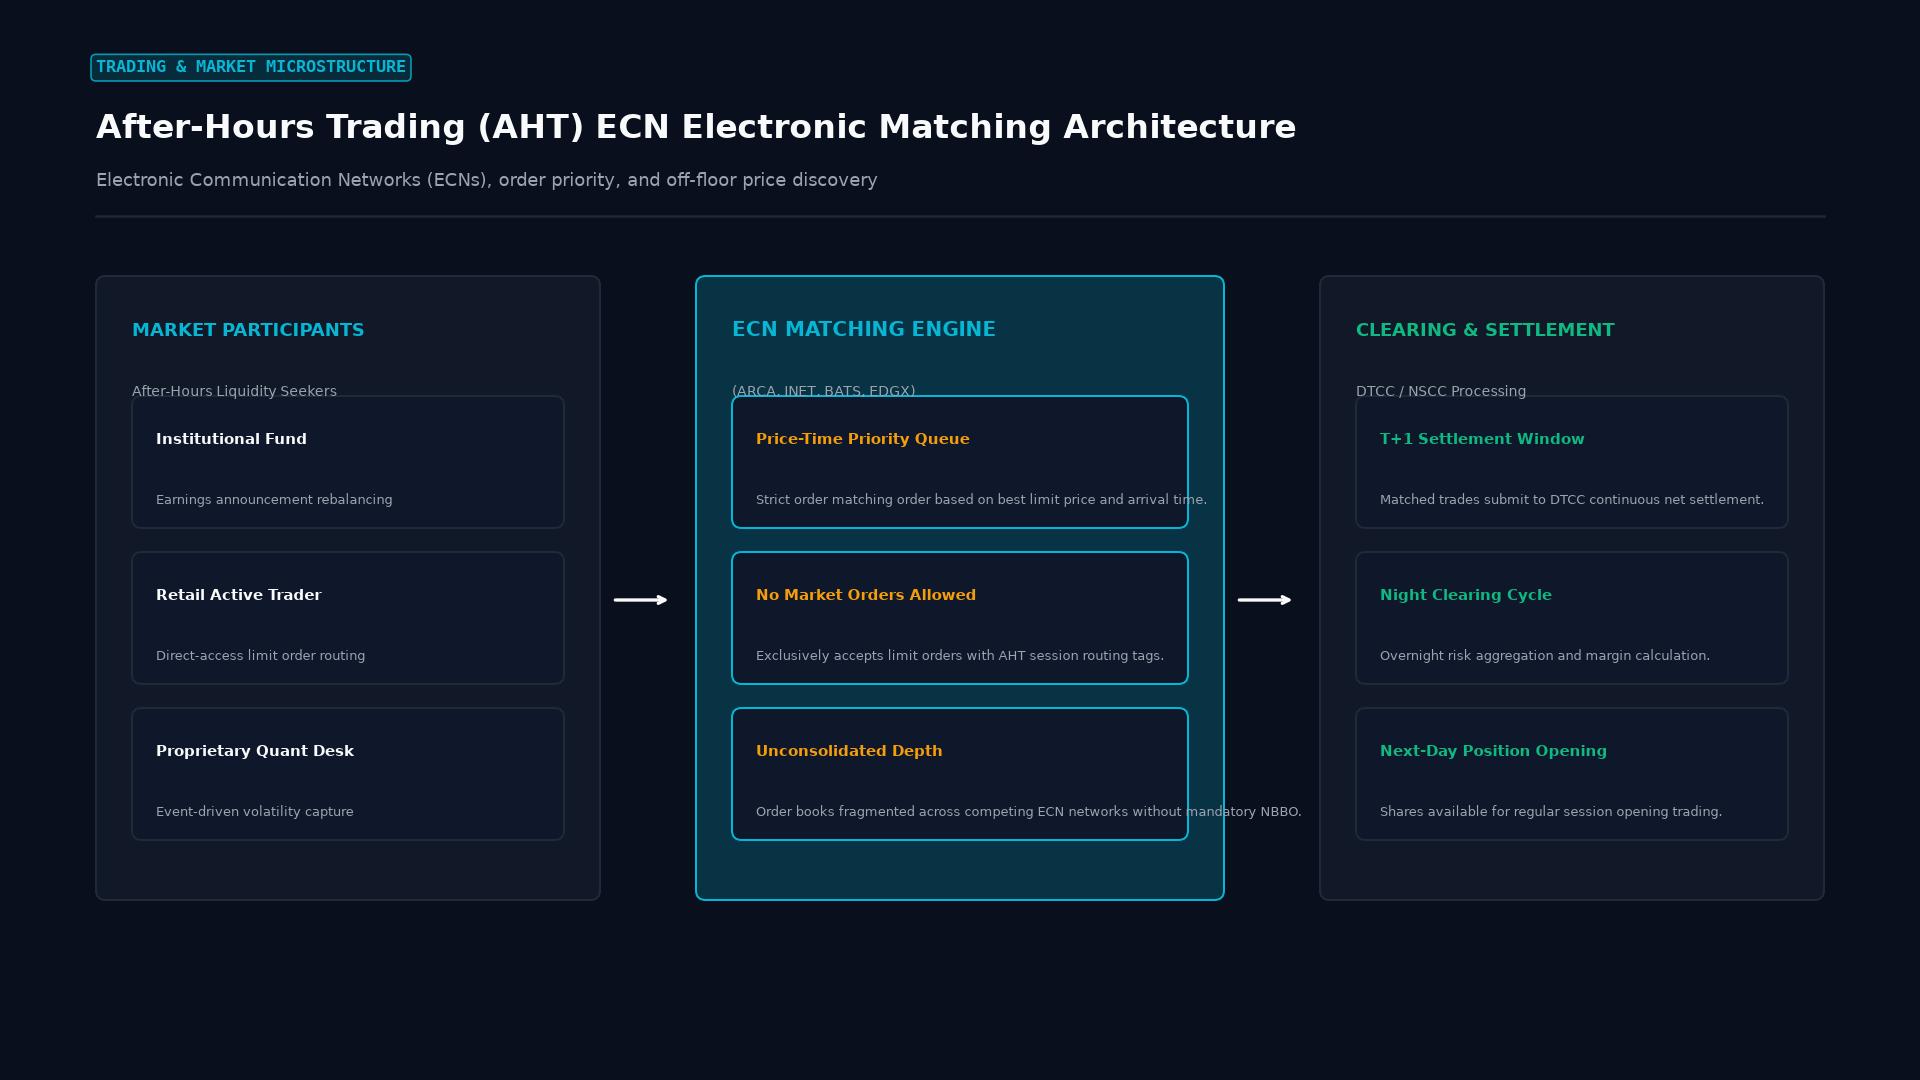 Figure: Electronic Communication Network (ECN) matching topology: off-floor limit order priority queues, dark book fragmentation, and overnight clearing submission.
Formula and Analytical Computation
In systematic trade evaluation, Average Holding Time is calculated as the arithmetic mean of all completed round-trip trades over an evaluation period:
$$\text{AHT} = \frac{1}{N} \sum_{i=1}^{N} \left( T_{\text{exit}, i} - T_{\text{entry}, i} \right)$$
Where:
- $N$ = Total number of closed round-trip trades
- $T_{\text{entry}, i}$ = Exact timestamp of trade execution
- $T_{\text{exit}, i}$ = Exact timestamp of final closing fill
For multi-asset hedge funds that scale into and out of positions in partial blocks, quantitative analysts compute Capital-Weighted Average Holding Time (CWAHT):
$$\text{CWAHT} = \frac{\sum_{i=1}^{N} \left( \text{Capital Committed}_i \times \text{Duration}i \right)}{\sum{i=1}^{N} \text{Capital Committed}_i}$$
Capital-weighting ensures that a tiny $10,000 speculative scratch trade held for 10 minutes does not distort the holding duration analysis of a $50,000,000 core currency hedge maintained for six months.
Operational Profiles Across Holding Time Horizons
A strategy’s AHT dictates its operational infrastructure and risk characteristics:
| Trading Style | Typical AHT Range | Primary Trading Edge | Structural Friction |
|---|---|---|---|
| High-Frequency (HFT) | Microseconds to seconds | Colocation speed, order book queuing | Exchange access fees, hardware depreciation |
| Scalping | 30 seconds to 5 minutes | Bid-ask spread capture, momentum bursts | Broker bid-ask spread and ticket commissions |
| Day Trading | 15 minutes to 4 hours | Intraday technical breakouts, VWAP reversions | High turnover requiring continuous focus |
| Swing Trading | 2 days to 3 weeks | Daily chart support/resistance, earnings momentum | Overnight financing rates and weekend gaps |
| Position / Macro | 1 month to 2 years | Economic cycles, central bank carry trade differentials | Opportunity cost of tied-up margin capital |
Impact of AHT on Transaction Costs and Alpha Decay
Understanding Average Holding Time is critical for evaluating net investment returns due to two opposing economic forces:
1. The Friction Burden of Short AHT Strategies
As AHT shrinks, trade frequency increases exponentially. A scalper executing 100 trades per day with an AHT of two minutes pays the bid-ask spread and clearing commissions 100 times. Even with microscopic execution costs of 0.5 pips per round turn, transaction frictions can consume 30% to 60% of gross trading profits.
Conversely, a swing trader with an AHT of two weeks might execute only four trades per month, making brokerage commission drag mathematically negligible.
Trading Friction vs. Overnight Risk Tradeoff:
┌──────────────────────────────┬──────────────────────────────┐
│ Short AHT (Minutes)          │ Long AHT (Weeks/Months)      │
├──────────────────────────────┼──────────────────────────────┤
│ • Zero overnight gap risk    │ • High overnight gap risk    │
│ • Severe commission friction │ • Negligible commission drag │
│ • High spread sensitivity    │ • Exposed to daily rollover  │
│ • Requires rapid execution   │   swap interest costs        │
└──────────────────────────────┴──────────────────────────────┘
2. Alpha Decay and Signal Horizon
In quantitative strategy development, alpha decay describes how rapidly an informational edge or mathematical anomaly loses predictive power as time elapses after the signal triggers.
High-frequency signals (such as limit order book imbalances) suffer complete alpha decay within milliseconds; holding the position beyond the optimal AHT turns a profitable strategy into random noise. Trend-following macro models, by contrast, rely on durable economic momentum signals where alpha persists for weeks, requiring extended holding durations to extract maximum profit.
Key Takeaways
- AHT stands for Average Holding Time, measuring the mean duration open positions are held from entry to exit.
- AHT defines trading classifications, spanning ultra-fast high-frequency trading (milliseconds) to position macro investing (months).
- Strategies with ultra-short AHT face heavy performance drag from bid-ask spreads and commissions, but eliminate overnight holding risk.
- Matching portfolio holding duration to the underlying model’s alpha decay rate is essential to maximize risk-adjusted Sharpe ratios.
Frequently Asked Questions
Why do institutional quantitative funds track AHT closely?
Institutional funds monitor AHT to detect “style drift.” If a quantitative model designed for swing trading with a target AHT of five days begins closing positions within three hours, risk managers investigate whether market volatility or execution algorithm errors are distorting the strategy’s intended behavior.
How does AHT influence overnight swap fees in Forex?
In foreign exchange markets, positions held past 5:00 PM Eastern Time incur daily rollover financing (swap charges or credits). Strategies with an AHT of less than a few hours completely avoid overnight swap fees, while swing and carry trade strategies with multi-week AHT must factor interest rate differentials directly into their net return expectations.
Can Average Holding Time indicate a trader’s emotional discipline?
Yes. Performance coaches use AHT analytics to identify psychological flaws. A common behavioral pathology among retail traders is an asymmetric holding time: holding losing trades for weeks in the hope of breaking even (extended losing AHT), while cutting winning trades within minutes out of fear (abbreviated winning AHT).
Ready to trade forex?
Open a free demo account with a regulated broker. Practice with virtual funds before risking real money.