Bear (Bearish)
A market condition, structural price trend, or trader sentiment characterized by anticipated or sustained asset price declines, driving market participants to execute short sales, hedge long exposures, and capitalize on downward momentum.
Bear (Bearish)
In global financial markets, the term bear describes a trader, investor, or institutional analyst who anticipates that the price of an asset, currency pair, commodity, or broader market index will decline. An asset or market regime is characterized as bearish when prices exhibit downward momentum, characterized by a persistent sequence of lower swing highs and lower swing lows. Market lore attributes the term to the physical manner in which a bear attacks: swiping downward with its claws, in direct contrast to the upward thrust of a bull’s horns.
In professional trading and portfolio management, bearishness is an analytical posture rather than an emotional or pessimistic worldview. Professional macro funds and proprietary desks exploit bearish market conditions by executing short sales, purchasing protective put options, establishing credit spreads, or holding cash reserves. In foreign exchange, where currencies trade in bilateral relative pairs, being bearish on one currency automatically represents a bullish conviction on the counter-currency.
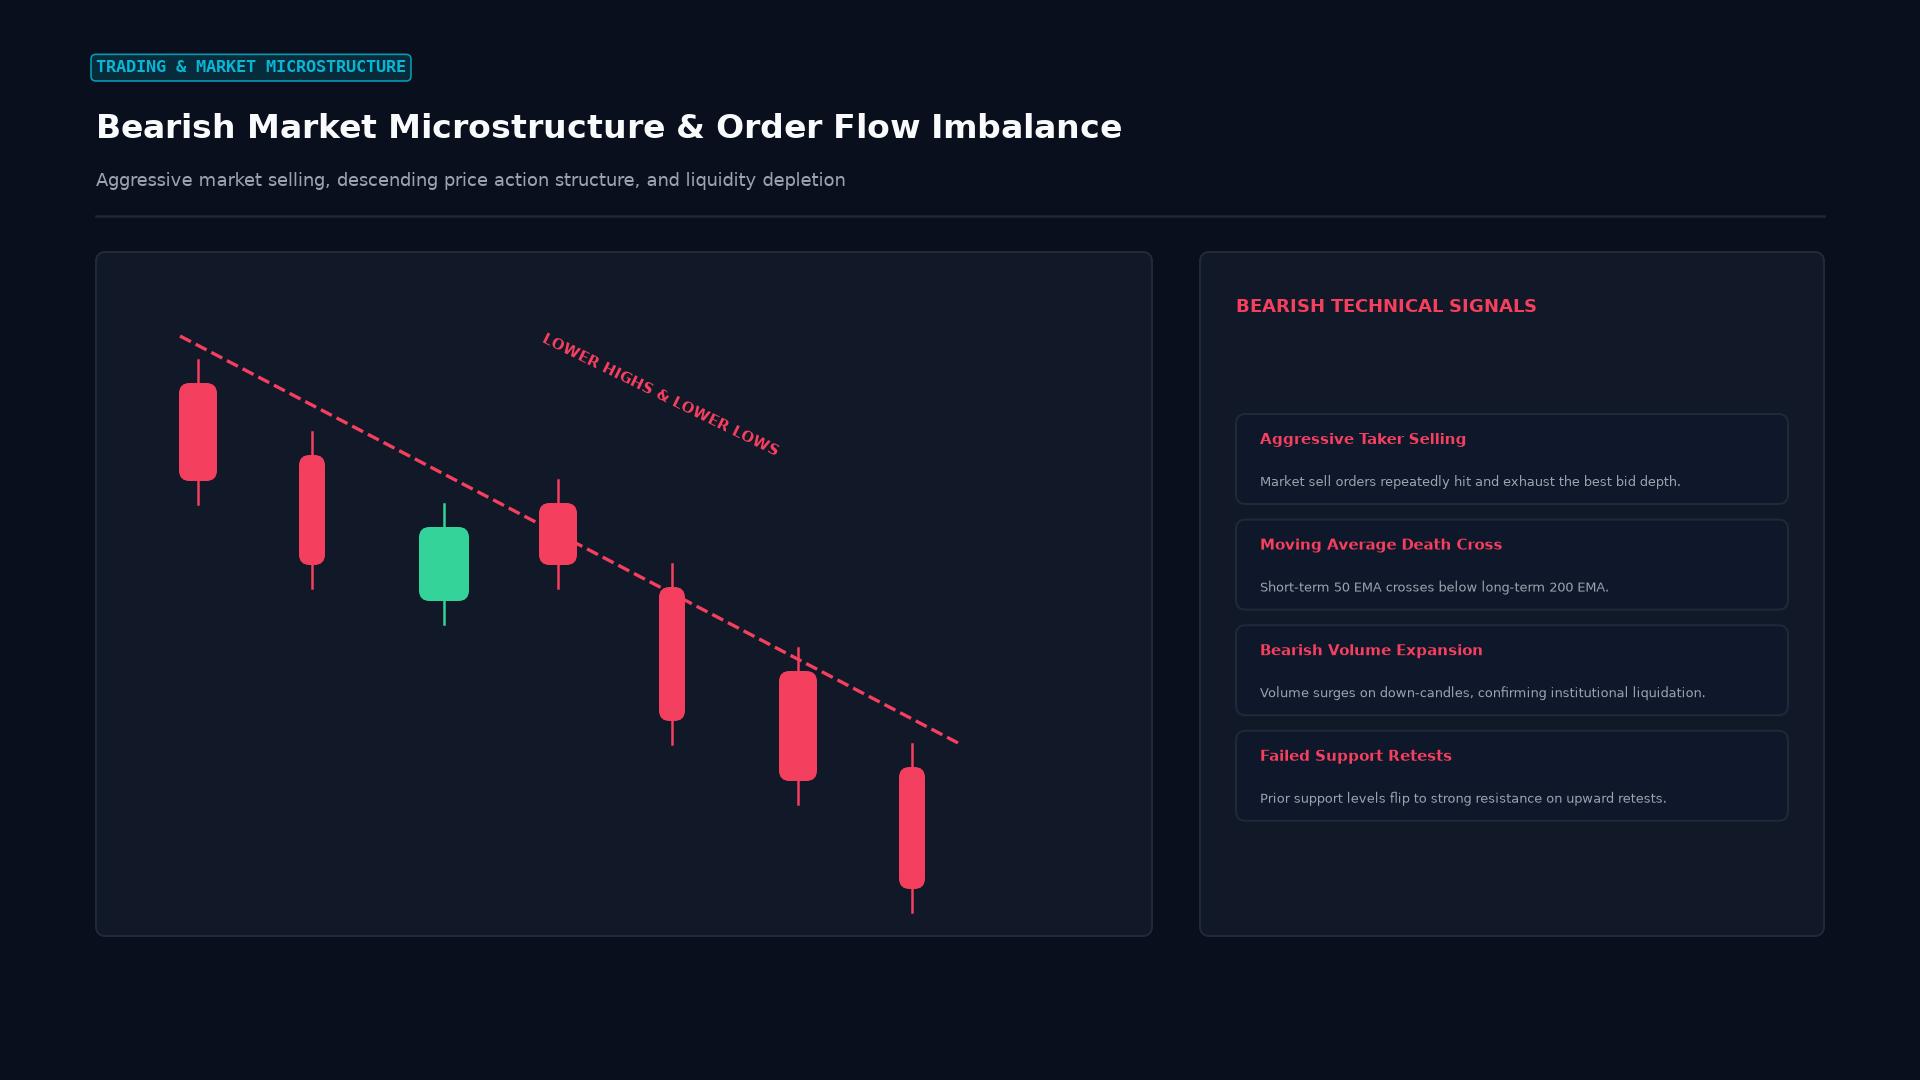 Figure: Order flow dynamics of a bearish regime: aggressive market sellers hitting bids, descending trendlines, lower highs/lows, and institutional distribution volume.
Quantitative Sentiment Diagnostics
Institutional trading desks do not rely on subjective headlines to evaluate market sentiment. Instead, they track quantitative indicators to measure aggregate bearishness across capital markets:
+--------------------------------------------------------------------------+
|                  Institutional Bearish Sentiment Scorecard               |
+--------------------------------------------------------------------------+
|  Quantitative Metric    | Operational Data Source | Bearish Threshold    |
+-------------------------+-------------------------+----------------------+
|  COT Net Speculative    | CFTC Weekly Commitments | Non-Commercial Net   |
|  Positioning            | of Traders Report       | Short at Multi-Year  |
|                         |                         | Extreme Percentile   |
|  Cboe Equity Put/Call   | Chicago Board Options   | Ratio Persistently   |
|  Ratio (PCR)            | Exchange Options Volume | Exceeds 0.85 to 1.10 |
|  AAII Bull-Bear Spread  | American Association of | Net Bear Sentiment   |
|                         | Individual Investors    | Exceeds +25% Spread  |
|  FINRA Margin Debt      | Financial Industry      | Rapid Contraction in |
|  Debit Balances         | Regulatory Authority    | Customer Margin Debt |
+--------------------------------------------------------------------------+
1. CFTC Commitments of Traders (COT) Analysis
Every Friday, the US Commodity Futures Trading Commission (CFTC) publishes the COT report, aggregating futures positions across institutional categories. Forex macro traders track the net positioning of Non-Commercial Traders (hedge funds and CTA trend-followers). When net short contracts on EUR or GBP reach the 90th percentile of their historical three-year distribution, deep bearish conviction is confirmed.
2. The Options Put/Call Ratio (PCR)
The put/call ratio measures trading volume in put options (downside insurance and speculative short bets) relative to call options. When institutional investors turn aggressively bearish, demand for protective puts surges, driving the equity put/call ratio above 1.0. A high ratio indicates widespread defensive positioning.
The Mechanics of Going Short: Equities vs. Forex
Executing a bearish view operates under fundamentally different mechanics depending on whether a trader is active in cash equities or foreign exchange:
+--------------------------------------------------------------------------+
|                  Shorting Mechanics: Equities vs. Spot Forex             |
+--------------------------------------------------------------------------+
|  Operational Feature  | Cash Equities / Bonds   | Spot Foreign Exchange  |
+-----------------------+-------------------------+------------------------+
|  Borrowing Mandate    | Must borrow physical    | Zero borrow required;  |
|                       | shares via prime broker | natural pair symmetry  |
|  Regulatory Friction  | SEC Reg SHO locate rules| Free of short-sale ban |
|                       | & uptick restrictions   | or circuit restrictions|
|  Carrying Costs       | Stock borrow fee        | Daily overnight swap   |
|                       | (GC vs Hard-to-Borrow)  | (long rate vs short)   |
|  Theoretical Risk     | Asymmetric: infinite    | Symmetrical: bounded   |
|                       | upside loss potential   | by sovereign currency  |
+--------------------------------------------------------------------------+
Cash Equity Short Selling and Regulation SHO
To short a corporate stock, an investor cannot simply press “sell.” The investor’s prime broker must locate available shares held in custody, borrow those shares, and deliver them to the market buyer. Under SEC Regulation SHO (Rule 203), broker-dealers must secure a valid “locate” before executing a short order.
If shares are scarce, the stock is designated as Hard-to-Borrow (HTB). Borrowers must pay annualized borrow fees ranging from 5% to over 100% on special issues.
The Bilateral Symmetry of Forex
In spot forex, short selling involves zero borrow logistics. Currencies are priced in relative pairs (such as EUR/USD). When a trader executes a “sell” on EUR/USD, they are borrowing Euros at the European benchmark rate to purchase US dollars that earn the US benchmark rate.
Because every forex trade is inherently long one currency and short another, going short is as structurally frictionless as going long.
The Anatomy of a Short Squeeze
The greatest operational risk confronting a bearish trader is a short squeeze. When heavily shorted assets encounter unexpected positive catalysts, the mechanics of short positions can trigger violent, parabolic rallies:
[ Extreme Consensus: Short Interest Surges to >30% of Available Float ]
                                │
                                ▼
[ Bullish Catalyst Occurs: Better-Than-Expected Earnings / Macro News ]
                                │
                                ▼
[ Initial Price Spike: Short Sellers Suffer Instant Mark-to-Market Losses ]
                                │
                                ▼
[ Margin Call Triggers: Brokers Force Automatic Buy-to-Cover Liquidations ]
                                │
                                ▼
[ Short Covering Cascades into Parabolic Spike: Liquidity Air Pocket ]
The Volkswagen Case Study (October 2008)
During the depths of the 2008 global financial crisis, hedge funds heavily shorted German automaker Volkswagen AG, expecting automotive insolvencies. Unknown to the market, Porsche had quietly accumulated cash-settled call options controlling 74.1% of Volkswagen’s voting shares, while the state of Lower Saxony held 20.2%.
When Porsche announced its holdings on Sunday, October 26, 2008, short sellers realized that only 5.7% of the company’s shares were freely floating in the public market, against a short interest of over 12%.
The scramble to buy back non-existent shares created a historic liquidity void. Over two trading sessions, Volkswagen stock surged from €210 to over €1,000, briefly making Volkswagen the most valuable corporation on earth. Several prominent hedge funds collapsed, illustrating the catastrophic tail risk of crowded bearish trades.
Wyckoff Distribution Framework: How Smart Money Turns Bearish
In classical technical analysis, Richard Wyckoff established that institutional operators do not dump positions in single panic blocks. Instead, they execute systematic distribution at market tops:
                      The Wyckoff Distribution Schematic
  Price
    ^
    |                        UTAD (Upthrust After Distribution)
    |                             /\
    |               BC           /  \
    |             /\            /    \
    |   PSY      /  \          /      \   LPSY (Last Point of Supply)
    |    /\     /    \   ST   /        \     /\
    |   /  \   /      \_/\___/          \   /  \
    |  /    \_/                          \_/    \
    | /      AR (Automatic Reaction)              \   SOW (Sign of Weakness)
    |/                                             \________/\
    +------------------------------------------------------------>
Phase A Phase B Phase C Phase D Phase E (Downtrend)- Preliminary Supply (PSY): Institutional smart money begins offloading massive long inventory into retail buying volume after a prolonged uptrend.
- Buying Climax (BC): Spectacular volume and wide price spreads as late retail traders chase the breakout, absorbing institutional sell blocks.
- Automatic Reaction (AR): Selling pressure exhausts buying depth, sparking an initial sharp decline that establishes the lower boundary of the trading range.
- Upthrust After Distribution (UTAD): A false breakout above the range highs designed to sweep stop-loss orders and trap breakout buyers before the real markdown begins.
- Sign of Weakness (SOW) & Markdown: Price plunges through structural support shelves on expanding volume, confirming the initiation of a full bearish trend.
Systematic Risk Management for Bearish Desks
Trading from the short side requires stricter risk parameters than long-only investing because the mathematical payoff of a short trade is inherently asymmetric:
- Maximum Profit Potential on a Short: Capped at 100% (if the asset price plunges to zero).
- Maximum Loss Potential on a Short: Theoretically infinite (an asset can appreciate hundreds of percent).
+--------------------------------------------------------------------------+
|                  Bearish Risk Mitigation Protocols                       |
+--------------------------------------------------------------------------+
|  Risk Control Method     | Institutional Execution Mandate               |
+--------------------------+-----------------------------------------------+
|  Hard Stop-Loss Orders   | Placed strictly beyond structural Wyckoff     |
|                          | supply shelves or daily ATR multiples         |
|  Synthetic Shorting      | Purchasing long put options (capping maximum  |
|  (Options Bear Put)      | loss strictly to the upfront premium paid)    |
|  Borrow Fee Monitoring   | Automating daily alerts if borrow rates on HTB|
|                          | equities exceed 15% annualized drag           |
|  Contrarian Sentiment    | Banning new short entries when AAII bear      |
|  Exhaustion Filters      | readings or COT shorts exceed 95th percentile |
+--------------------------------------------------------------------------+
Frequently Asked Questions
What is the difference between a bear market and being bearish?
Being bearish is a directional market opinion or short-term trading stance held by an investor. A bear market is a formalized macroeconomic condition defined as a prolonged decline of 20% or more in a major market index (such as the S&P 500 or MSCI World) from its recent cyclical peak, typically accompanied by economic recession and broad corporate earnings contractions.
Why do market declines happen faster than market rallies?
Behavioral finance proves that human beings experience loss aversion: the emotional pain of a financial loss is psychologically twice as intense as the joy of an equivalent gain (Kahneman and Tversky). When prices break below key support, panic selling, margin call liquidations, and risk-management stop orders trigger simultaneously, causing rapid liquidity evaporation. Upward bull trends require persistent capital accumulation, which develops more gradually over time.
What is a contrarian bearish indicator?
When traditional sentiment gauges show that everyone in the market has turned overwhelmingly bearish (e.g., record high put/call ratios or extreme non-commercial net short futures positions), it functions as a contrarian bullish signal. If all market participants have already sold or established short positions, there is no one left to sell. Any marginal positive news catalyst triggers short covering, igniting a sharp counter-trend rally.
Ready to trade forex?
Open a free demo account with a regulated broker. Practice with virtual funds before risking real money.