Bull (Bullish)
A market condition, directional price trend, or investor conviction characterized by expanding asset valuations, persistent upward price momentum, and risk-seeking capital allocation driven by expanding liquidity and macroeconomic growth.
Bull (Bullish)
In global financial markets, the term bull describes an investor, trader, or institution anticipating that asset prices, currency exchange rates, or broad market indices will appreciate. A market regime is designated as bullish when price action displays persistent upward momentum, characterized by a structured sequence of higher swing highs and higher swing lows. Financial lore traces the term to the aggressive upward thrust of a bull’s horns, contrasting with the downward swipe of a bear’s claws.
In professional trading and asset management, bullishness is far more than casual optimism. It reflects a systematic assessment of capital flows, corporate earnings growth, expanding liquidity, and positive risk appetite. In currency trading, being bullish on a specific currency requires capital to flow out of competing alternatives into the favored currency, driven by interest rate differentials, favorable terms of trade, and sovereign capital inflows.
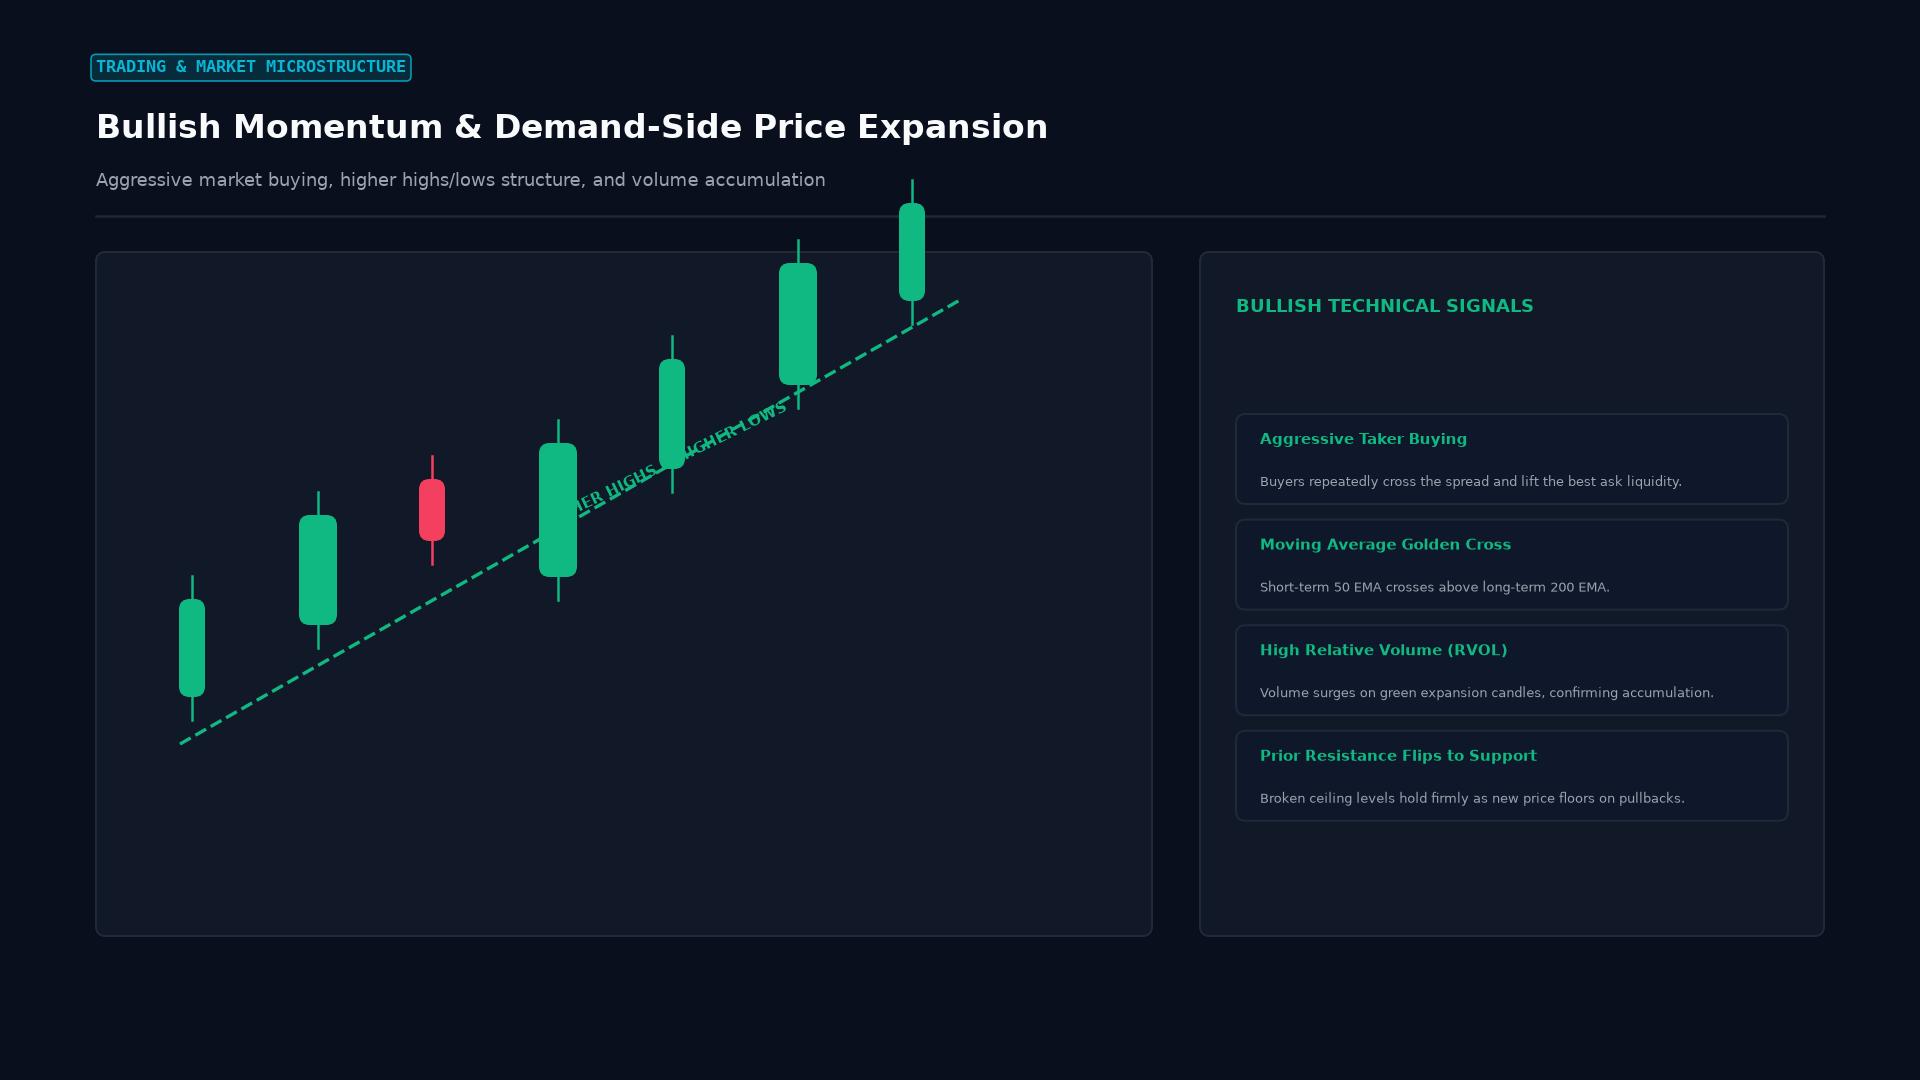 Figure: Demand-side market dynamics: aggressive market buyers lifting offers, ascending trendline structure, moving average golden crosses, and expanding volume.
Macroeconomic and Liquidity Drivers of Bullish Regimes
While intraday price fluctuations can be sparked by technical patterns, sustained multi-month and multi-year bull markets require powerful macroeconomic and monetary tailwinds:
+--------------------------------------------------------------------------+
|                  The Macroeconomic Pillars of a Bull Market              |
+--------------------------------------------------------------------------+
|  Economic Driver        | Transmission Mechanism to Financial Assets     |
+-------------------------+------------------------------------------------+
|  Central Bank Balance   | Expanding fiat liquidity (QE, rate cuts) forces|
|  Sheet Expansion (M2)   | capital into risk assets to generate real yield|
|  Corporate Earnings     | Operating leverage expands profit margins      |
|  Acceleration (EPS)     | faster than revenue growth during expansions   |
|  Credit Spread          | Tightening high-yield corporate bond spreads   |
|  Compression (CSWAP)    | signals low default risk, fueling M&A and risk |
|  FX Carry Trade         | Capital borrows in low-rate funding currencies |
|  Capital Inflows        | to invest in high-yielding sovereign debt      |
+--------------------------------------------------------------------------+
1. Global Fiat Liquidity Cycles
Asset valuations correlate directly with global money supply metrics (Global M2). When central banks (the Federal Reserve, European Central Bank, Bank of Japan, and People’s Bank of China) expand their aggregate balance sheets or reduce policy benchmark rates, excess banking reserves flow into liquid capital markets. With cash yields depressed, institutional capital is forced up the risk curve into equities, real estate, and high-beta emerging market currencies.
2. Risk-On Sentiment in Foreign Exchange
In foreign exchange markets, bullish market regimes manifest as a risk-on environment. Investors abandon low-yielding safe-haven currencies (such as the Swiss Franc and Japanese Yen) to purchase growth-oriented commodity currencies (such as the Australian Dollar, New Zealand Dollar, and Canadian Dollar).
When global equities rally, carry trade volume surges, expanding yield pickups across frontier economies.
Market Microstructure of Bull Trends
At the level of the electronic limit order book (CLOB), a bullish trend is driven by persistent imbalances between aggressive market buyers and passive limit sellers:
+--------------------------------------------------------------------------+
|                  Order Book Microstructure in a Bull Market              |
+--------------------------------------------------------------------------+
|                                                                          |
|  [ Aggressive Market Buy Orders: Crossing the Spread ]                   |
|  Traders submit market buy orders that systematically consume all        |
|  liquidity resting at the Ask price, forcing the quote to step higher.   |
|                                                                          |
|  [ Passive Limit Bids: Stepping Up Support Floors ]                      |
|  Institutional algorithms place heavy limit bid orders immediately below |
|  the current price, absorbing minor sell-offs and establishing higher    |
|  structural lows (Higher Lows).                                          |
|                                                                          |
|  [ Positive Cumulative Volume Delta (CVD) ]                              |
|  CVD = Total Aggressive Buyer Volume - Total Aggressive Seller Volume    |
|  Persistent upward-sloping CVD confirms strong institutional buying.     |
|                                                                          |
+--------------------------------------------------------------------------+
Technical Trend Moving Average Alignments
Systematic quantitative trend-followers confirm bullish regimes using standardized moving average filters:
- The Golden Cross: Occurs when the short-term 50-day Simple Moving Average (SMA) crosses above the long-term 200-day SMA, confirming multi-month momentum.
- Stacked Moving Average Alignment: A textbook bull trend displays expanding moving averages arranged in perfect descending chronological order (Price > 20 EMA > 50 SMA > 100 SMA > 200 SMA), with all averages sloping upward.
Wyckoff Accumulation Framework: How Institutions Build Bull Moves
Before a major bull market ignites, institutional operators accumulate massive inventory without driving prices higher. Richard Wyckoff modeled this structural process through the Wyckoff Accumulation Schematic:
                      The Wyckoff Accumulation Schematic
  Price
    ^
    |                                                SOS (Sign of Strength)
    |                                                      /\
    |                                            LPS      /  \
    |                                            /\      /    \
    |                   ST                      /  \_/\_/      \
    |   PS             /\      Phase B         /
    |    /\     AR    /  \      Trading       /
    |   /  \    /\   /    \      Range       /
    |  /    \  /  \_/      \________________/
    | /      \/
    |/       SC (Selling Climax)           \_/
    |                                       Spring (Phase C Shakeout)
    +------------------------------------------------------------>
Phase A Phase B Phase C Phase D Phase E (Uptrend)- Preliminary Support (PS) & Selling Climax (SC): Institutional buyers step in during a panic selloff, absorbing retail liquidations at deeply discounted prices.
- Automatic Rally (AR) & Secondary Test (ST): A sharp short-covering bounce defines the upper boundary of the base, followed by a retest of the lows on declining volume.
- The Spring (Phase C Shakeout): Price briefly breaches structural support to trigger stop-losses and flush out weak retail holders. When price rejects the breakdown and snaps back inside the range, the spring confirms that supply is exhausted.
- Sign of Strength (SOS) & Markup: Institutional buyers drive price out of the accumulation base on expanding volume, kicking off the active bullish markup phase.
The Hazards of Speculative Euphoria and Blow-Off Tops
While bull markets generate substantial wealth, prolonged bull runs cultivate cognitive biases that expose investors to catastrophic reversals:
[ Fundamental Macro Expansion: Sustainable Corporate Earnings Growth ]
                               │
                               ▼
[ Retail Speculative Participation: Fear of Missing Out (FOMO) ]
                               │
                               ▼
[ Margin Debt Expansion: Borrowing Capital to Leverage Long Exposure ]
                               │
                               ▼
[ Speculative Euphoria: Valuation Multiples Reach Historical Extremes ]
                               │
                               ▼
[ Market Breadth Deteriorates: Mega-Cap Tech Rallies while Mid-Caps Sag ]
                               │
                               ▼
[ Blow-Off Top: Parabolic Vertical Price Spike on Climax Volume ]
+--------------------------------------------------------------------------+
| Late-Stage Bull Market Vulnerability Scorecard |
+--------------------------------------------------------------------------+
| Indicator Metric | Healthy Bull Benchmark | Late-Cycle Warning |
+-------------------------+-------------------------+----------------------+
| FINRA Margin Debt | Growing steadily with | Vertical parabolic |
| Debit Balances | broad market equity cap | surge (>35% YoY) |
| Advance-Decline Line | Rising in tandem with | Diverging downward; |
| (Market Breadth) | headline index levels | narrow index rally |
| Shiller CAPE Ratio | Historical median: 16x | Stretches past 30x |
| (Cyclically Adjusted) | to 22x P/E multiples | to 38x P/E extremes |
| Retail Call Options | Moderate hedge volume | Record speculative |
| Volume (0DTE Mania) | in standard monthly puts| zero-day call buying |
+--------------------------------------------------------------------------+The Mechanism of a Blow-Off Top
In the final phase of a bull market, skepticism vanishes entirely. Late-arriving retail investors, convinced that prices can never fall, deploy maximum leverage.
The market prints a vertical, parabolic spike known as a blow-off top. When smart money exhausts its distribution and bids evaporate, the market falls into a vacuum, triggering cascading margin liquidations that mark the birth of a bear market.
Systematic Execution Playbook for Bullish Traders
Professional momentum and trend-following desks adhere to disciplined operational rules during bullish regimes:
+--------------------------------------------------------------------------+
|                  Bullish Trading Desk Execution Protocols                 |
+--------------------------------------------------------------------------+
|  Strategy Component     | Institutional Implementation Standard          |
+-------------------------+------------------------------------------------+
|  Entry Timing           | Never chase vertical green bars; wait for      |
|                         | pullbacks to touch the rising 20 EMA or test   |
|                         | prior broken resistance (support retests).     |
|  Stop-Loss Placement    | Position protective stops 1.5 to 2.0 ATR       |
|                         | units below the most recent verified swing low.|
|  Pyramiding Winning     | Add incremental size (half clips) only after a |
|  Positions              | trade breaks into profit and prints a new HL.  |
|  Profit Taking          | Scale out into euphoric spikes; maintain a     |
|                         | trailing runner managed via Chandelier exits.  |
+--------------------------------------------------------------------------+
Frequently Asked Questions
Can an investor be bullish on a market during an economic recession?
Yes. Financial markets are forward-looking discounting mechanisms that lead real economic activity by six to nine months. Equity markets routinely bottom and begin aggressive bull runs in the middle of severe recessions, precisely when corporate layoffs dominate headlines, because investors anticipate central bank liquidity easing and subsequent corporate profit recoveries.
What is the difference between a bull market and a cyclical bear market rally?
A genuine bull market is characterized by broad market breadth (the majority of equities participating in the rally), expanding trading volume, supportive monetary policy, and structural breaks above multi-month resistance shelves. A bear market rally is a sharp, short-lived counter-trend bounce driven primarily by short-covering, which quickly exhausts into overhead supply on declining volume.
What does “buying the dip” mean in a bull market?
Buying the dip is a trading tactic that involves purchasing an asset during a temporary price decline (retracement) within an established upward trend. In a confirmed bull market, pullbacks to key support levels (such as horizontal demand zones or the 50-day moving average) offer high-probability entry points with asymmetric risk-to-reward ratios.
Ready to trade forex?
Open a free demo account with a regulated broker. Practice with virtual funds before risking real money.