Calendar Effect
A calendar effect is an empirical anomaly in financial markets where asset prices and returns exhibit systematic, statistically significant patterns or seasonal deviations correlated with specific calendar periods, days of the week, or months.
What Is the Calendar Effect?
In empirical asset pricing and behavioral finance, a calendar effect refers to any persistent, statistically observable tendency of asset returns to deviate systematically based on the calendar date, day of the week, month, or proximity to holidays and fiscal year-ends.
The existence of calendar effects presents a direct theoretical challenge to Eugene Fama’s Efficient Market Hypothesis (EMH), which asserts that in an informationally efficient market, asset prices follow a random walk where future expected returns cannot be predicted using historical calendar dates. Quantitative researchers and systematic hedge funds model these calendar anomalies to optimize execution algorithms, harvest risk premia, and manage institutional liquidity flows.
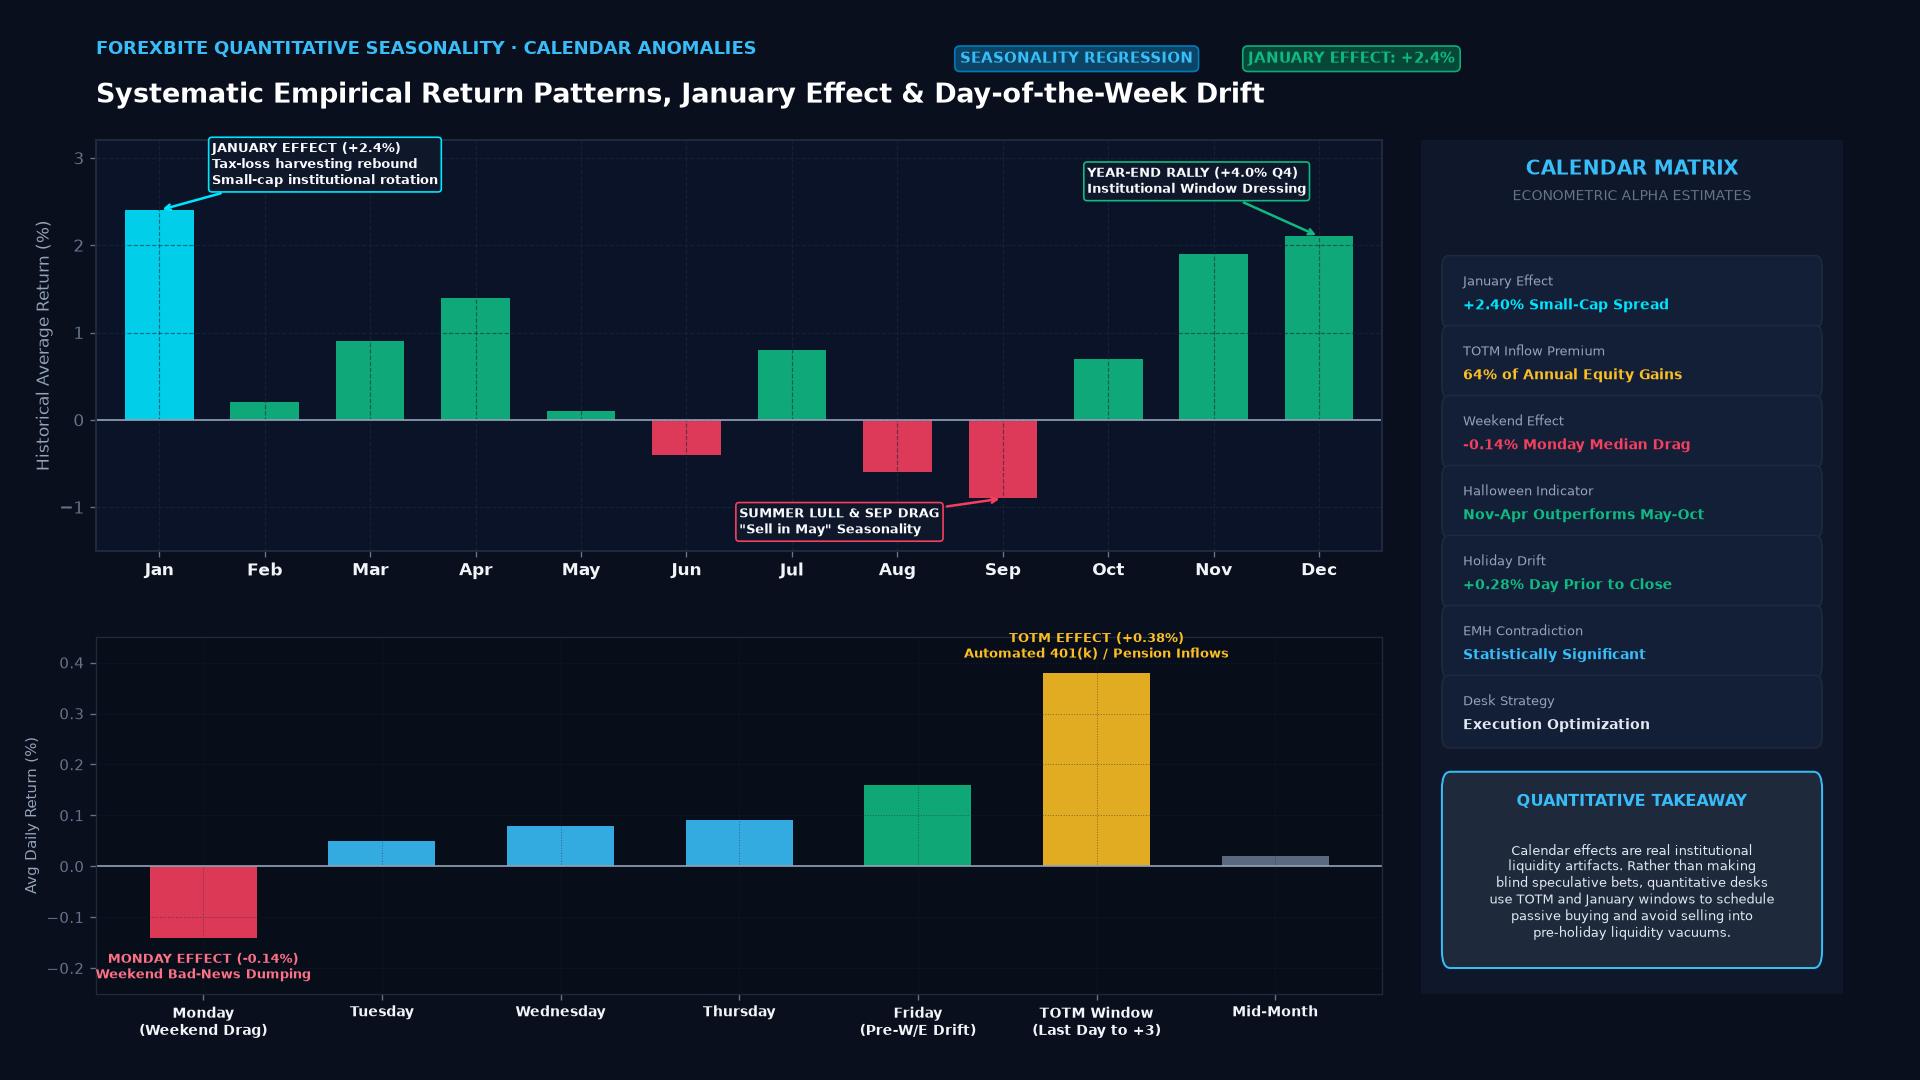 Figure: Empirical calendar return anomalies illustrating the January Effect (+2.4%), Q4 year-end rally, Turn-of-the-Month (TOTM) inflow premium, and Monday weekend drag.
Technical Mechanics & Econometric Verification
To distinguish genuine calendar anomalies from random data-mining noise, quantitative researchers estimate dummy-variable regression models:
The Classical Seasonality Regression
$$R_t = \alpha + \sum_{k=1}^{m} \beta_k D_{k,t} + \epsilon_t$$
Where:
- $R_t$: Daily or monthly asset return at time $t$.
- $\alpha$: Baseline benchmark return.
- $D_{k,t}$: Indicator (dummy) variable equal to $1.0$ if period $t$ falls within calendar window $k$, and $0.0$ otherwise.
- $\beta_k$: Estimated seasonal return differential.
- $\epsilon_t$: Residual error term.
To reject the null hypothesis of market efficiency ($H_0: \beta_k = 0$), researchers require a $t$-statistic exceeding $|2.0|$ ($p < 0.05$). Furthermore, modern quant desks apply the Bonferroni correction or White’s Reality Check to adjust for multiple hypothesis testing and eliminate data-snooping bias:
$$p_{\text{adjusted}} = \min(1, m \cdot p)$$
Calendar Anomalies Across Financial Markets
| Calendar Anomaly | Asset Class Impact | Market Drivers | Institutional Exploitation |
|---|---|---|---|
| The January Effect | Russell 2000 vs. S&P 500 | Year-end tax-loss selling followed by January reinvestment | Long small-cap / Short large-cap pairs trade |
| Turn-of-the-Month (TOTM) | S&P 500, Global Equities | Institutional salary sweeps, dividend reinvestment, 401(k) allocations | Passive long index exposure concentrated on days $[-1, +3]$ |
| End-of-Month FX Rebalancing | G10 Currency Pairs (EUR/USD, GBP) | Global equity portfolio managers re-hedging currency exposure | Front-running 16:00 London WMR Benchmark Fix |
| The Weekend Effect | Equities and Sovereign Debt | Information clustering; negative corporate disclosures on Friday evenings | Short equity exposure over weekend holds |
Real-World Case Study: The Arbitrage Decay of the January Effect
First documented by investment banker Sidney Wachtel in 1942 and popularized by Donald Keim in 1983, the January Effect historically showed that small-cap US equities generated massive outperformance during the first two to three weeks of January.
The Lifecycle of a Market Anomaly:
1. Historical Regime (1925-1980): Small-cap stocks systematically beat large-caps in January by an average of 3.5% to 5.0%. The driver was mechanical: investors dumped losing stocks in December to claim tax losses, then bought them back in January with year-end cash bonuses.
2. Academic Discovery & Publication: Extensive academic papers published in the 1980s exposed the anomaly to the broader financial industry.
3. Algorithmic Front-Running (1990s-2010s): Hedge funds realized that waiting until January 2 to buy was sub-optimal. Quants began buying distressed small-caps in mid-December, and eventually late November.
4. Alpha Compression: By the 2010s, the January Effect had largely vanished from January returns; the abnormal price surge shifted into the last two weeks of December or compressed to statistical insignificance.
This phenomenon illustrates a foundational tenet of modern financial economics: once a systematic calendar anomaly is widely identified and capitalized, market arbitrageurs trade it until the excess return is eliminated.
Frequently Asked Questions (FAQ)
What causes the Turn-of-the-Month (TOTM) effect in equity markets?
The Turn-of-the-Month (TOTM) effect is primarily driven by institutional cash-flow mechanics rather than irrational psychology. At the close of each calendar month and the first three business days of the subsequent month, hundreds of billions of dollars in automated corporate capital are deployed: employee payroll deductions are swept into retirement accounts (such as 401(k) plans), mutual funds reinvest accumulated dividends, and pension funds rebalance their asset allocations. This concentrated, price-insensitive institutional buying pressure reliably lifts broad equity market indices.
How do seasonal calendar effects manifest in foreign exchange (FX) markets?
In foreign exchange, calendar effects are driven by multinational corporate tax deadlines, sovereign debt settlements, and fiscal calendar year-ends. For example, Japanese multinational corporations and financial institutions traditionally repatriate overseas foreign exchange earnings back into Japanese Yen (JPY) ahead of the Japanese fiscal year-end on March 31, frequently creating seasonal strength in the Yen during late February and March. Similarly, the 16:00 London Fix on the final trading day of every month triggers massive mechanical currency re-hedging by global equity fund managers.
Does the “Sell in May and Go Away” rule still work in modern markets?
The “Sell in May” phenomenon (the Halloween Indicator) posits that global equities generate significantly higher returns from November through April than from May through October. While historical backtests over a 50-year horizon show statistically higher returns during the winter half-year, relying on it as a binary trading strategy carries severe opportunity costs. In many modern years (such as 2020, 2021, and 2023), equity markets experienced explosive summer rallies driven by technology earnings and macroeconomic policy shifts, inflicting heavy underperformance on investors who exited the market in May.
Ready to trade forex?
Open a free demo account with a regulated broker. Practice with virtual funds before risking real money.