VIX (Cboe Volatility Index)
The VIX is a real-time volatility index calculated by Cboe that measures market expectations of 30-day forward annualized volatility for the S&P 500 index, derived from the bid/ask quotes of SPX index options.
What Is the VIX?
The Cboe Volatility Index (VIX) is the premier benchmark of market sentiment and expected volatility in global financial markets. Frequently referred to as Wall Street’s “Fear Gauge,” the VIX calculates the market’s expectation of 30-day forward annualized volatility for the US stock market by aggregating the weighted prices of standard SPX index put and call options across a wide spectrum of strike prices.
Unlike realized (historical) volatility, which measures the dispersion of past daily price returns, the VIX is entirely forward-looking and model-free. Because institutional portfolio managers aggressively buy out-of-the-money put options to hedge equity portfolios during market downdrafts, implied volatility spikes sharply during market stress, giving the VIX an established negative correlation with the S&P 500.
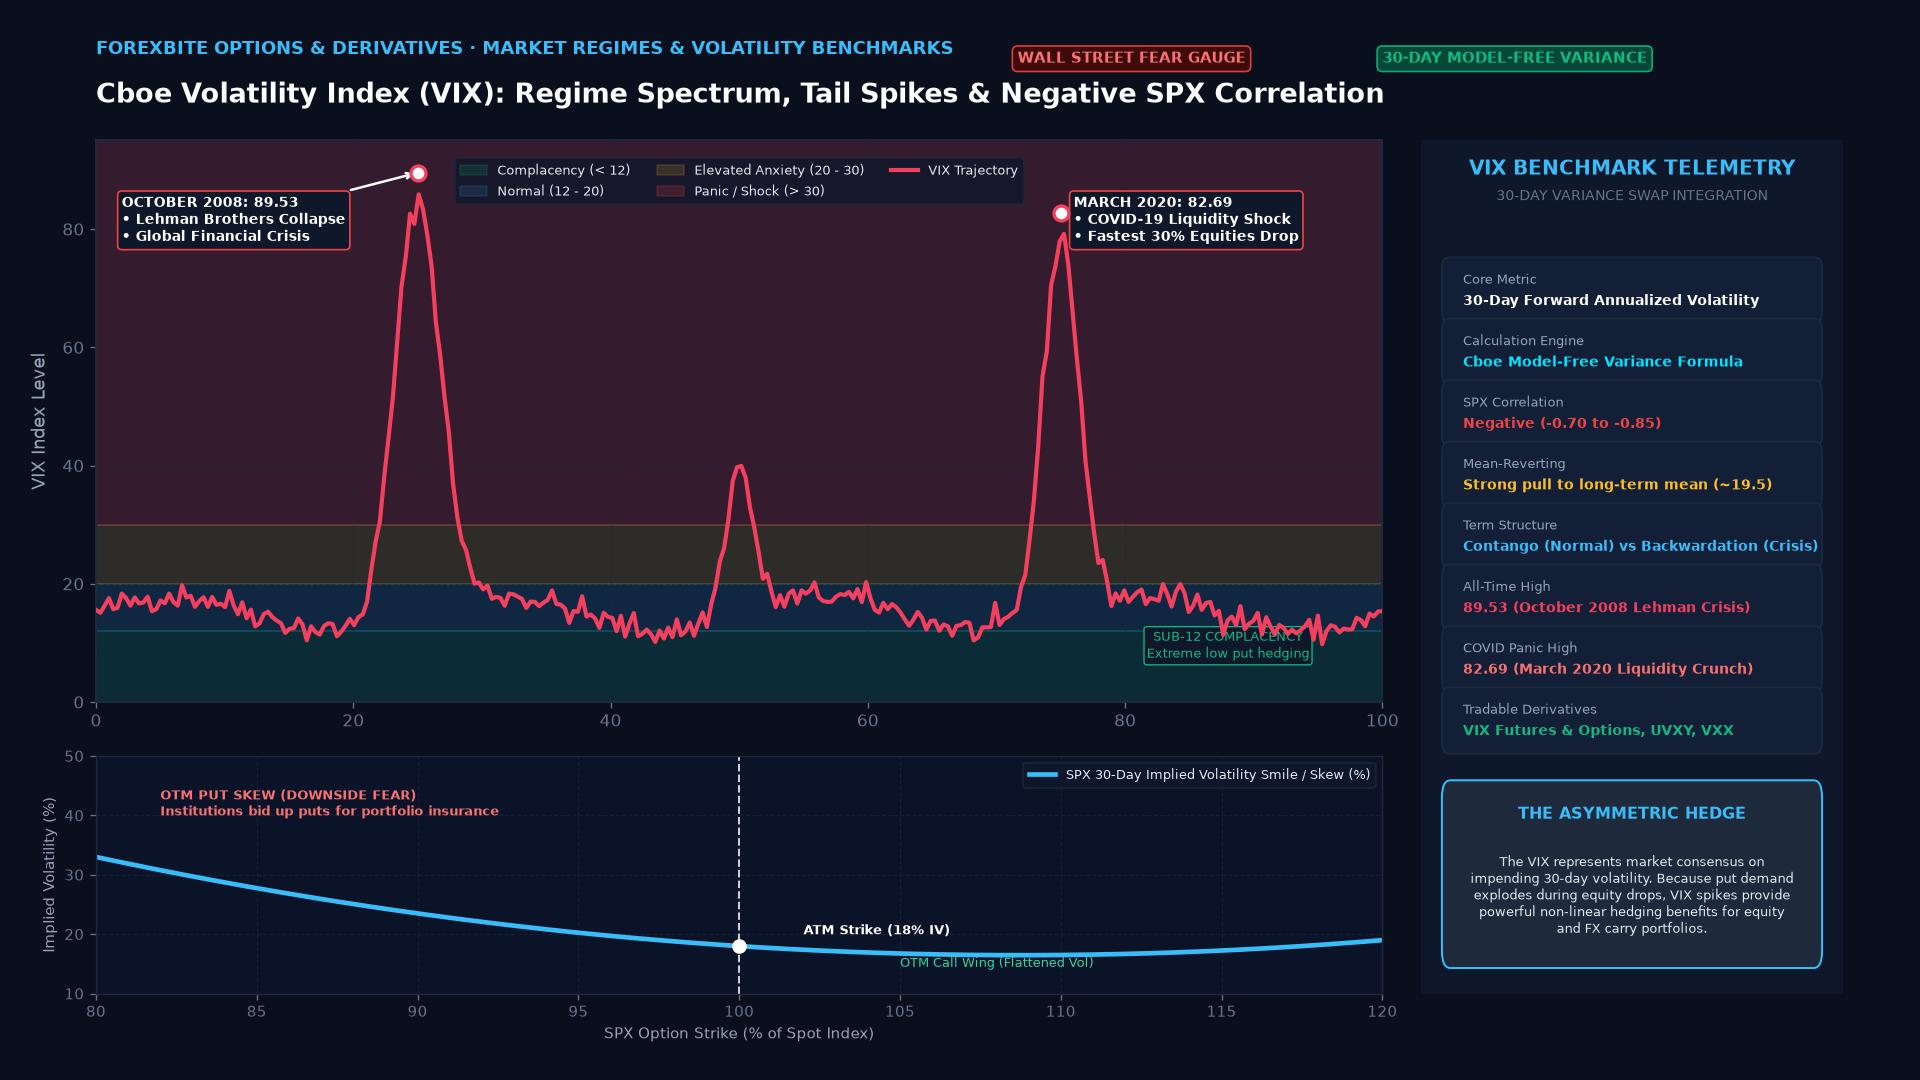
Mathematical Formulation: The Cboe Model-Free Calculation
Rather than relying on Black-Scholes inversion (which assumes constant volatility across strikes and log-normal distributions), the modern VIX calculation uses a model-free formulation based on the theoretical price of a variance swap.
The annualized 30-day variance ($\sigma^2$) is calculated as:
$$\sigma^2 = \frac{2}{T} \sum_i \frac{\Delta K_i}{K_i^2} e^{R T} Q(K_i) - \frac{1}{T} \left[ \frac{F}{K_0} - 1 \right]^2$$
Where:
- $T$: Time to expiration in years (calculated to the precise minute).
- $R$: Risk-free interest rate to expiration.
- $F$: Forward index level derived from index option prices: $$F = \text{Strike Price} + e^{R T} \times (\text{Call Price} - \text{Put Price})$$
- $K_0$: First strike price below the forward index level $F$.
- $K_i$: Strike price of the $i$-th out-of-the-money (OTM) option.
- $\Delta K_i$: Interval between adjacent strike prices: $$\Delta K_i = \frac{K_{i+1} - K_{i-1}}{2}$$
- $Q(K_i)$: The midpoint of the bid-ask spread for each option with strike $K_i$.
Once variance ($\sigma^2$) is calculated for both near-term and next-term option expirations (interpolated to an exact 30-day tenor), the headline VIX index value is derived as:
$$\text{VIX} = 100 \times \sqrt{\sigma^2}$$
A VIX reading of 20.0 indicates that option markets price in an annualized expected move in the S&P 500 of $20%$ over the next 30 days. To convert this to an approximate daily expected percentage range, traders apply the Rule of 16 ($\sqrt{252 \text{ trading days}} \approx 15.87$):
$$\text{Expected Daily Move} \approx \frac{\text{VIX}}{16} = \frac{20}{16} = 1.25%$$
VIX Futures Term Structure: Contango vs. Backwardation
The relationship between spot VIX and its subsequent monthly futures contracts provides critical information regarding market risk appetite:
Term Structure Dynamics:
Futures Price
  ^
  |                          /--- CONTANGO (Normal Market: Far > Near)
  |                         /     * Roll yield is negative for long ETF holders
  |                        /
  |  --------------------+------------------------ Spot VIX
  |                        \
  |                         \--- BACKWARDATION (Panic: Near > Far)
  |                              * Inverted curve; urgent immediate demand
+---------------------------------------------> Expiration Tenor| State | Curve Shape | Drivers | Market Implications |
|---|---|---|---|
| Contango | Upward-sloping (M2 > M1 > Spot) | Time decay, demand for far-dated catastrophe insurance | Bullish baseline; long volatility products suffer massive negative roll yield |
| Backwardation | Downward-sloping (Spot > M1 > M2) | Acute institutional demand for immediate front-month tail-risk hedges | Severe market shock; short-term crash risk heavily premiumized |
Real-World Case Study: “Volmageddon” (February 5, 2018)
Throughout 2017, the VIX traded at historic lows, averaging below 11.0. This prolonged period of subdued volatility led institutional and retail investors to pour billions into short-volatility exchange-traded products, most notably the VelocityShares Daily Inverse VIX Short-Term ETN (ticker: XIV).
Feb 5, 2018 ("Volmageddon"):
1. VIX opened at 17.30 amid modest inflation fears.
2. S&P 500 closed down 4.10% (115 points).
3. Post-market rebalancing: Inverse ETNs were legally required to purchase VIX futures to reset their short exposures.
4. Feedback Loop: Accelerated futures buying triggered unprecedented squeeze.
5. VIX spiked +115.6% intraday to 37.32 (largest single-day point increase in history).
6. Result: XIV lost 96% of its net asset value in 60 minutes and was terminated.
This structural blowup illustrated that derivative volatility products are not passive price mirrors; massive positioning in volatility derivatives can reflexively dictate the underlying cash equity market’s liquidity.
Frequently Asked Questions (FAQ)
Can retail traders buy or sell the spot VIX index directly?
No. The VIX is a calculated statistical index, not an investable asset that can be physically created or held like a stock or barrel of crude oil. Traders access VIX exposure through derivative instruments, including Cboe VIX futures, VIX options, and exchange-traded products (such as VXX, UVXY, or SVIX). These products track rolling futures contracts rather than the spot index itself, meaning their performance diverges significantly from the spot VIX over time due to futures contango and roll decay.
Why does the VIX spike more sharply during market declines than during rallies?
This structural asymmetry is rooted in investor psychology and portfolio hedging behavior. When equities rally, gains typically accumulate in an orderly, continuous manner, keeping implied volatility compressed. In contrast, market declines are frequently sudden, volatile, and driven by liquidation orders. As institutional fund managers scramble to purchase out-of-the-money put options to prevent catastrophic drawdowns, the surge in option bid prices mechanically forces the VIX formula higher.
How does the VIX impact foreign exchange (FX) currency markets?
The VIX serves as a global risk sentiment thermometer for currency traders. During low VIX regimes (below 15), global carry trades thrive; investors borrow low-yielding currencies (like the Japanese Yen or Swiss Franc) to buy high-yielding emerging market or commodity currencies (like the Australian Dollar, New Zealand Dollar, or Mexican Peso). When the VIX spikes above 25 or 30, carry positions are aggressively unwound, sparking rapid rallies in traditional safe-haven currencies (USD, JPY, CHF) while risk-correlated currencies experience steep depreciations.
Ready to trade forex?
Open a free demo account with a regulated broker. Practice with virtual funds before risking real money.