Capacity Utilization
A key macroeconomic and industrial metric published by central banks measuring the percentage of an economy's total potential industrial output that is actively being utilized by factories, mines, and electric and gas utilities, serving as a critical leading gauge of inflationary pressure and economic slack.
What is Capacity Utilization?
Capacity utilization is a vital macroeconomic indicator that measures the proportion of an economy’s industrial production capacity actively being utilized to manufacture goods. Published monthly in the United States by the Federal Reserve Board as part of the G.17 Industrial Production and Capacity Utilization statistical release, the index tracks activity across three primary industrial sectors: manufacturing, mining, and electric and gas utilities.
Rather than measuring the theoretical absolute maximum output (which would involve running machinery 24/7 without maintenance), capacity is defined as the sustainable practical maximum output—the highest level of production a facility can maintain under realistic work schedules, normal downtime, and accessible supply chains.
$$\text{Capacity Utilization Rate (%)} = \left( \frac{\text{Actual Industrial Output}}{\text{Potential Sustainable Capacity}} \right) \times 100$$
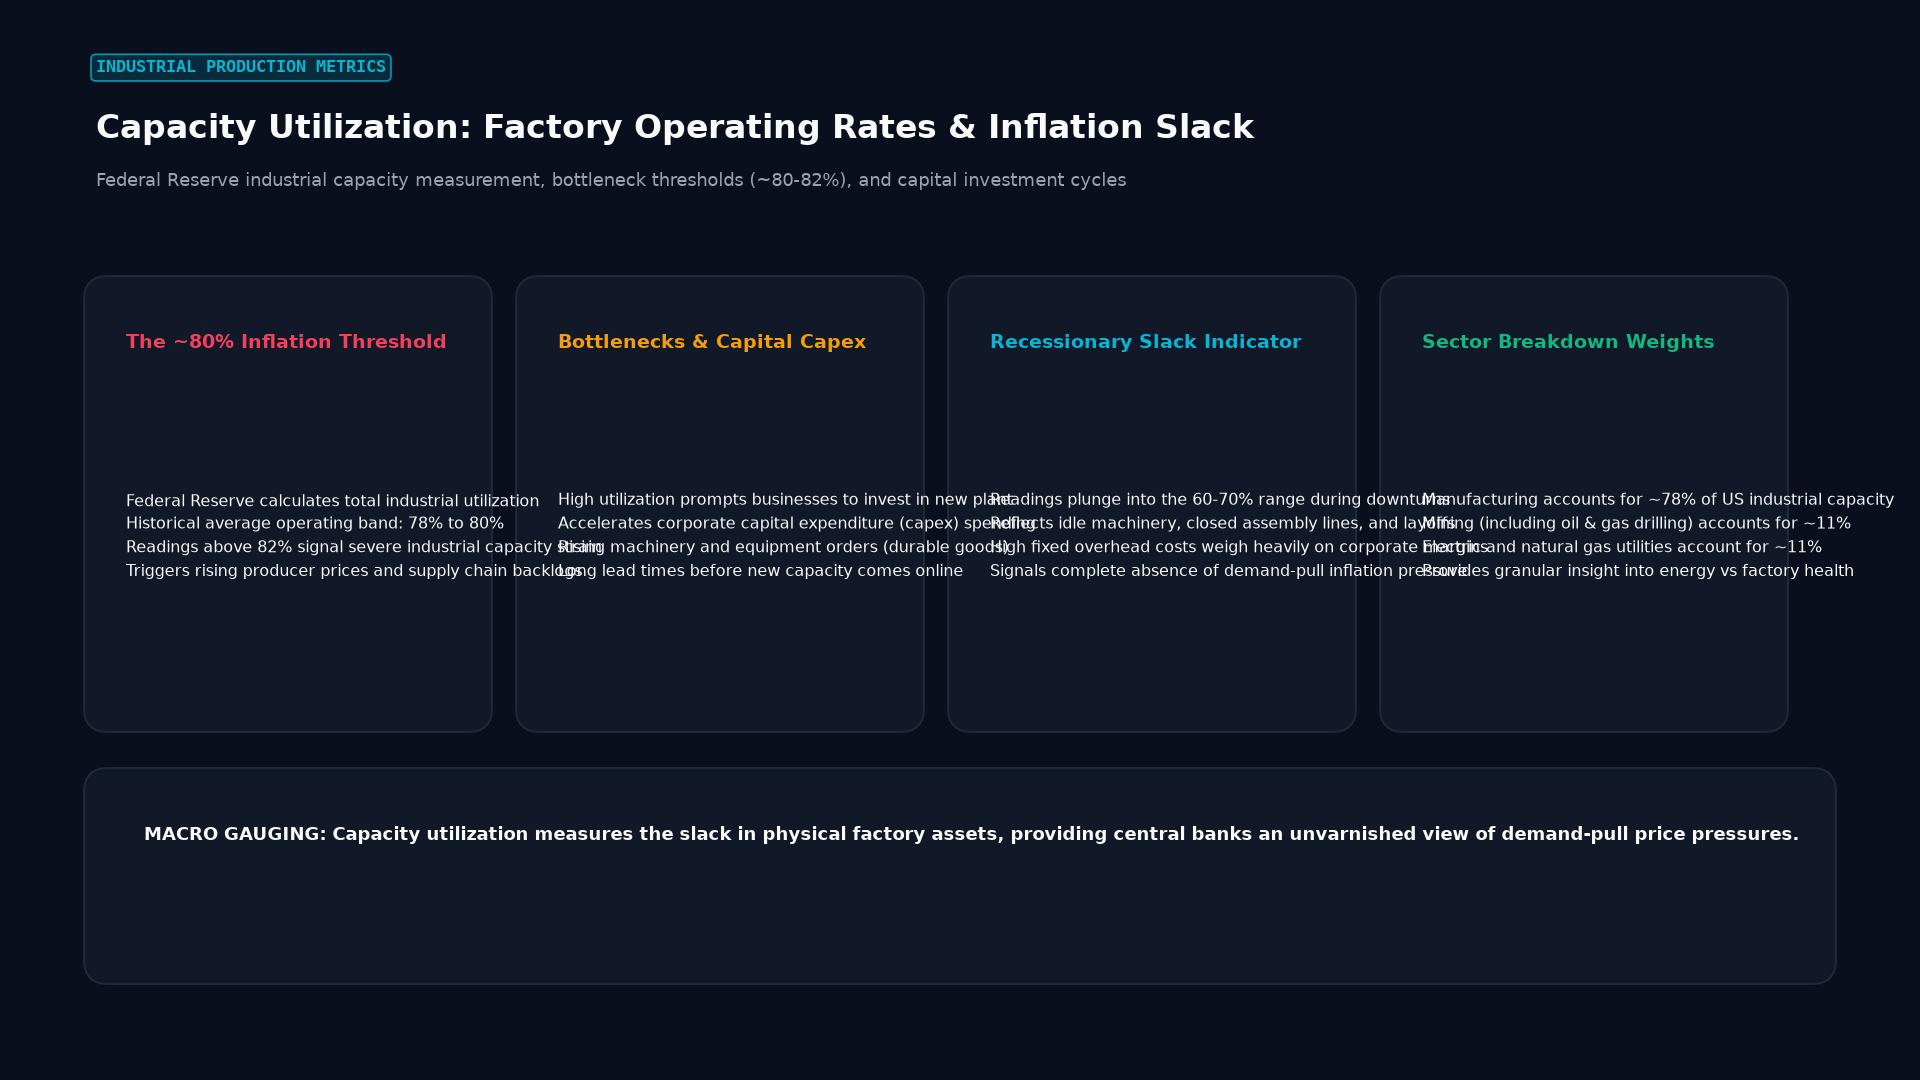 Figure: Federal Reserve industrial capacity measurement, bottleneck thresholds (~80-82%), and capital investment cycles
The Economic Threshold: The 82% Inflation Bottleneck
Macroeconomists and central bankers view capacity utilization as the ultimate barometer of structural economic slack:
1. Recessionary Slack (Below 75%)
When utilization drops below 75% (such as during the 2008 Great Financial Crisis, when U.S. utilization collapsed to a historic low of 66.7%), severe economic slack exists. Capital equipment sits idle, industrial firms lay off workers, and pricing power evaporates. Central banks respond by slashing interest rates and injecting liquidity (monetary easing).
2. The Balanced Equilibrium Zone (78% to 82%)
Historically, an overall operating rate between 78% and 82% represents healthy, non-inflationary economic expansion. Capital investment is productive, employment is strong, and factories operate within design parameters without incurring excessive maintenance costs.
3. The Inflationary Flashpoint (Above 82% to 85%)
When capacity utilization pushes past 82% to 83%, physical industrial bottlenecks emerge:
- Factories must pay premium overtime wages to run extra shifts.
- Aging machinery is run past scheduled maintenance intervals, causing frequent breakdowns and expensive emergency repairs.
- Raw material shortages and transportation bottlenecks force manufacturers to bid aggressively against one another for scarce inputs.
- Industrial producers pass these soaring costs directly down the supply chain, triggering rapid acceleration in the Producer Price Index (PPI) and ultimately consumer inflation (CPI).
Currency Transmission: How Capacity Utilization Impacts the Forex Market
Foreign exchange traders monitor capacity utilization releases closely because of their direct transmission to monetary policy and currency exchange rates:
   High Capacity Utilization (>83%)
                 |
                 v
   Industrial Bottlenecks & Factory Cost Surges
                 |
                 v
   Accelerating Producer & Consumer Inflation
                 |
                 v
   Central Bank Tightening (Interest Rate Hikes)
                 |
                 v
   Widening Sovereign Bond Yield Differentials
                 |
                 v
   DOMESTIC CURRENCY APPRECIATION (Bullish EUR, USD, etc.)
When monthly capacity utilization reports exceed consensus expectations, currency desks immediately price in a higher probability of central bank rate hikes. Short-term sovereign bond yields climb, attracting international foreign exchange flows and driving up the domestic currency against trading partners with lower utilization rates.
Historical Macroeconomic Case Study: U.S. Cycles
Evaluating historical U.S. capacity utilization cycles illustrates its power as a leading indicator of macroeconomic turning points:
| Historical Era | Peak / Trough Utilization | Macroeconomic Environment | Federal Reserve Policy Reaction | U.S. Dollar Impact |
|---|---|---|---|---|
| 1973–1974 Oil Crisis | Peak: 88.4% | Severe industrial overheating & supply shortages | Aggressive tightening (Rates hiked past 11%) | Extreme volatility; stagflation headwinds |
| Late 1990s Tech Boom | Peak: 84.2% | High-productivity expansion & capital investment | Moderate rate hikes to prevent overheating | Strong Dollar Era (USD bull market) |
| 2008 Financial Crisis | Trough: 66.7% | Widespread factory closures, credit freeze | Zero Interest Rate Policy (ZIRP) + QE1 | Flight-to-safety initial USD surge, then drop |
| 2021–2022 Post-Covid | Rebound: 80.5% | Global supply chain snarls, microchip deficits | Fastest rate hiking cycle in 40 years | Historic U.S. Dollar rally (DXY above 114) |
Comparative Matrix: Macroeconomic Industrial Indicators
| Economic Indicator | Publishing Body | Frequency | Primary Focus | Distinction from Capacity Utilization |
|---|---|---|---|---|
| Capacity Utilization | Federal Reserve | Monthly | Percentage of potential output realized | Directly identifies supply bottlenecks & structural slack |
| Industrial Production (IP) | Federal Reserve | Monthly | Absolute physical volume of output | Measures physical quantity, not capacity headroom |
| Manufacturing PMI | ISM / S&P Global | Monthly | Survey-based purchasing manager sentiment | Qualitative sentiment index; not hard production data |
| GDP Output Gap | IMF / OECD / CBO | Quarterly | Aggregate actual vs potential national GDP | Broad macroeconomic estimate; published with long lag |
Key Takeaways
- Capacity utilization measures the percentage of sustainable potential industrial output being actively produced by an economy.
- In the United States, it is published monthly by the Federal Reserve Board alongside the Industrial Production index.
- Utilization rates above 82% signal industrial bottlenecks, labor shortages, and impending producer inflation.
- Rates below 75% indicate deep economic slack, recessionary conditions, and disinflationary pressures.
- Strong capacity utilization figures typically bolster a currency, as forex markets anticipate interest rate hikes to counter overheating.
Frequently Asked Questions
Why doesn’t an economy want 100% capacity utilization?
Operating at 100% capacity is economically destructive. It means factories are running without regular maintenance, workers are exhausted from mandatory overtime, machinery failure rates surge, and supply lines break down. The optimal long-run non-accelerating inflation rate of capacity is typically between 80% and 82%.
How does the Federal Reserve estimate “total capacity”?
The Federal Reserve models industrial capacity using comprehensive annual surveys from the U.S. Census Bureau, capital expenditure data, industry-specific trade association statistics, and depreciation models to calculate how much output American industry can sustainably produce.
Which sector within capacity utilization is most volatile?
The utilities sector (electric and gas utilities) displays the highest month-to-month volatility, largely because energy consumption is heavily dictated by unseasonal weather shocks (severe winter freezes or extreme summer heatwaves).
How does capacity utilization differ from the unemployment rate?
While the unemployment rate measures slack in the labor market (human capital), capacity utilization measures slack in physical capital (factories, machinery, assembly lines, and mining infrastructure). Both metrics are complementary gauges used by central banks to estimate the total output gap.
Ready to trade forex?
Open a free demo account with a regulated broker. Practice with virtual funds before risking real money.