Chartists
Financial market participants who rely primarily on graphical price charts, geometric formations, candlestick patterns, and mathematical indicators to analyze market psychology, identify emerging trends, and execute trading strategies.
Who are Chartists?
In financial market terminology, chartists (synonymous with technical analysts or price action traders) are market participants who study historical price action, trading volume, and graphical chart patterns to forecast future price trajectories and time market entries and exits.
While fundamental analysts scrutinize balance sheets, central bank interest rate policies, GDP statistics, and macroeconomic data, chartists operate on the premise that all relevant economic information, market sentiment, insider knowledge, and institutional order flow are already completely reflected and discounted in the current market price.
Dating back to 18th-century Japanese rice trading (where Munehisa Homma pioneered candlestick analysis) and late 19th-century Wall Street (where Charles Dow articulated Dow Theory), chartism has evolved from hand-drawn paper charts into sophisticated electronic multi-screen algorithmic charting terminals.
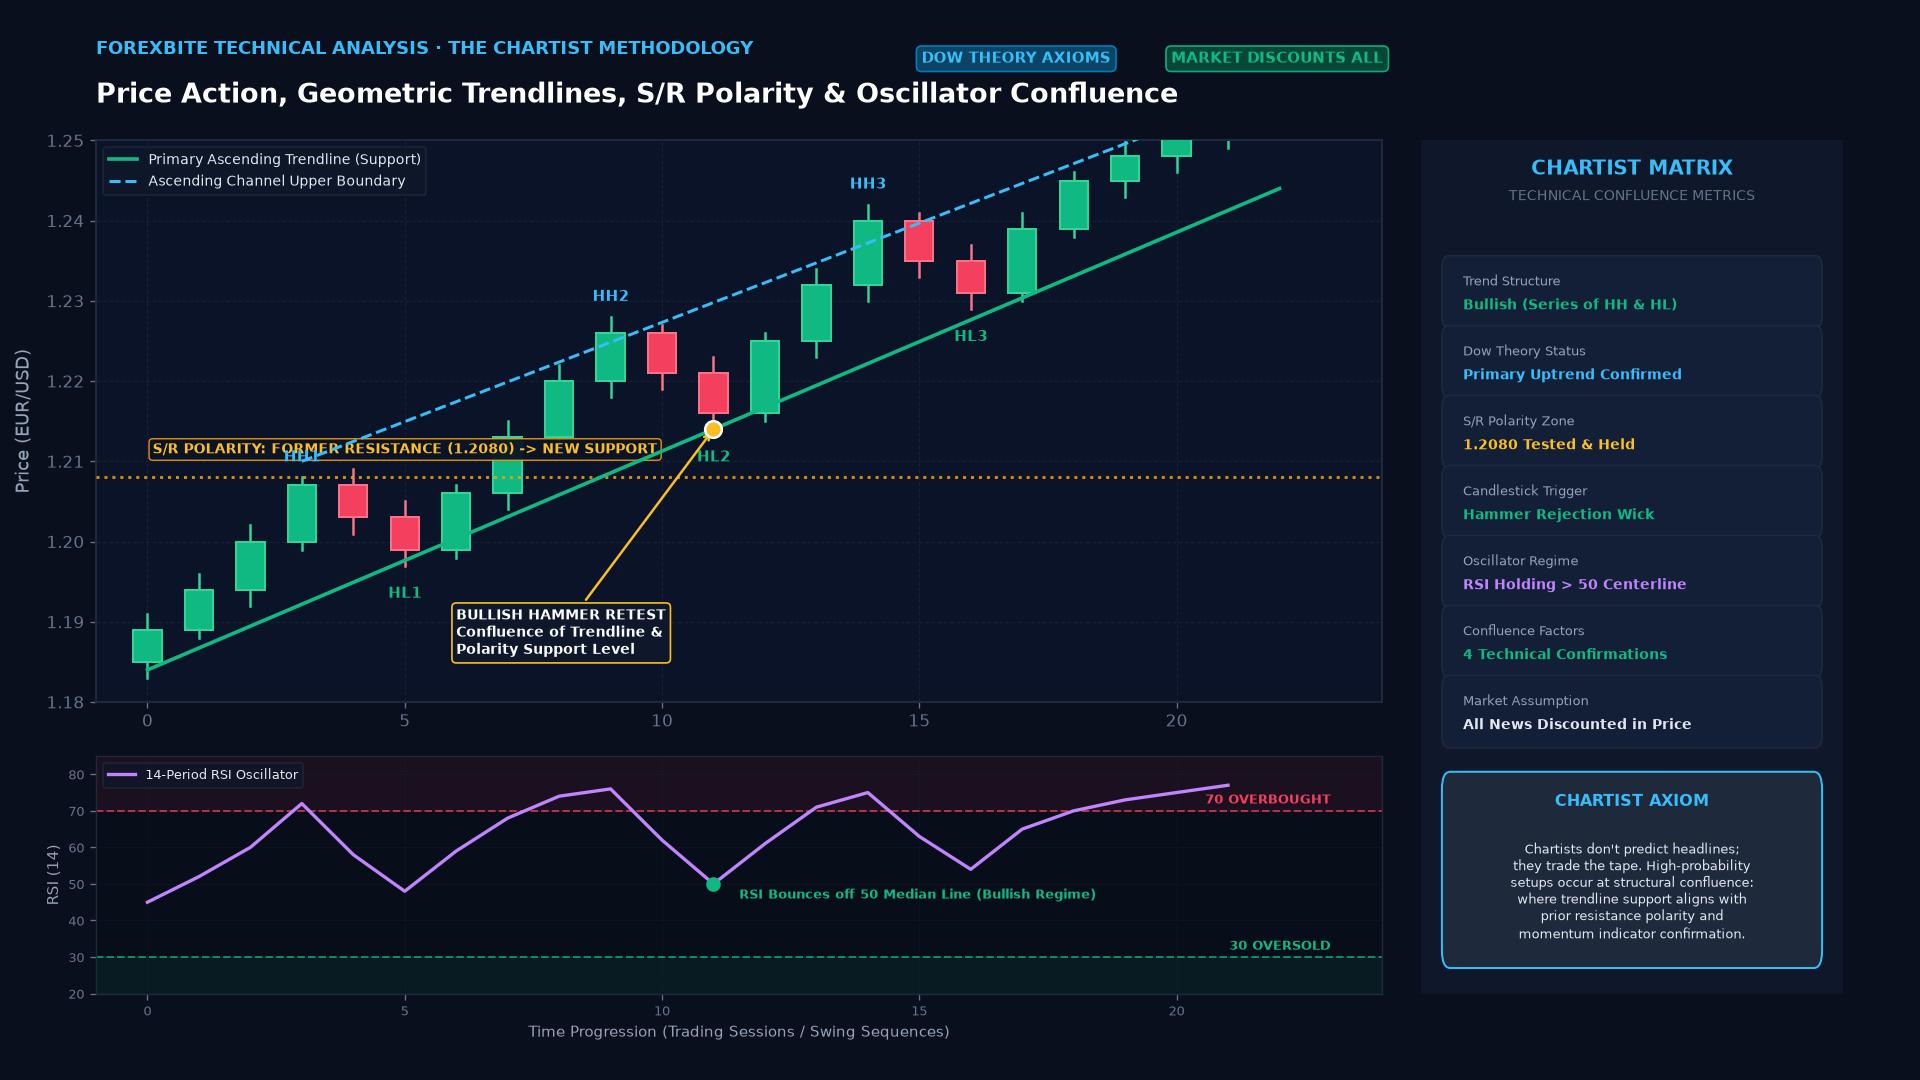 Figure: The Chartist analytical framework illustrating Dow Theory trend channels, support/resistance polarity, bullish hammer retest, and RSI oscillator confluence.
The Primary Methodologies in the Chartist Toolkit
Modern chartists employ four distinct technical frameworks to dissect currency and capital markets:
1. Classical Geometric Chart Patterns
Chartists identify macro behavioral setups formed by consolidation and breakout boundaries:
- Reversal Formations: Head and Shoulders, Inverted Head and Shoulders, Double Tops and Bottoms, Triple Tap rejections.
- Continuation Formations: Bull and Bear Flags, Pennants, Ascending and Descending Triangles, Cup and Handle formations.
2. Candlestick Analysis (Price Action)
Originating in feudal Japan, individual candlesticks and short multi-candle clusters visualize the immediate battle between buyers (bulls) and sellers (bears):
- Indecision / Reversal Signals: Doji, Hammer, Shooting Star, Hanging Man.
- Momentum Absorptions: Bullish and Bearish Engulfing patterns, Morning and Evening Stars.
3. Quantitative Mathematical Indicators
Chartists calculate mathematical derivatives of price and volume:
- Trend-Following: Simple Moving Averages (SMA), Exponential Moving Averages (EMA), Parabolic SAR.
- Momentum Oscillators: Relative Strength Index (RSI), Moving Average Convergence Divergence (MACD), Stochastic Oscillator.
- Volatility Envelopes: Bollinger Bands, Average True Range (ATR), Keltner Channels.
4. Market Structure & Structural Geometry
- Support and Resistance: Identifying historical horizontal price levels where institutional liquidity pools congregate.
- Fibonacci Ratios: Applying mathematical proportions (38.2%, 50.0%, 61.8%) to measure pullback depths within larger trends.
Chartists vs. Fundamental Analysts: The Philosophical Divide
The perennial debate in trading centers on the divergence between technical and fundamental analysis:
| Trading Dimension | Chartist (Technical Analyst) | Fundamental Analyst |
|---|---|---|
| Core Question | “When and at what price should I trade?” | “What asset should I trade and why?” |
| Primary Data Source | Open, High, Low, Close (OHLC), Volume, Time | Interest rates, GDP, inflation (CPI), corporate earnings |
| Decision Speed | Milliseconds to minutes (High agility) | Days to weeks (Requires report analysis) |
| Trade Horizon | Scalping, Day Trading, Multi-Day Swing | Multi-Month to Multi-Year Macro Holds |
| Risk Management | Precise structural stop-losses on chart levels | Valuations, margin of safety, portfolio rebalancing |
| Primary Vulnerability | False breakouts, whipsaws in news events | Being fundamentally “right” too early (running out of margin) |
Many successful hedge funds combine both disciplines: fundamentals dictate the directional bias, while chartism dictates the precise execution entry and risk parameters.
The Academic Debate: Self-Fulfilling Prophecy vs. Data Mining
Academic economists and advocates of the Efficient Market Hypothesis (EMH) frequently criticize chartism:
- The Self-Fulfilling Prophecy Argument: Critics argue that chart patterns (like a 200-day moving average bounce or a breakout above resistance) work not because of mystical mathematical laws, but simply because millions of retail traders, hedge fund quants, and algorithmic bots are all watching the identical level and placing orders simultaneously. For a professional trader, however, whether a pattern works due to intrinsic truth or collective psychology is irrelevant—it provides an actionable edge.
- Data-Mining Bias and Hindsight Fallacy: Looking backward at historical charts, it is easy to spot clean patterns. In real-time trading, however, charts develop with incomplete information on the right-hand edge, requiring rigorous probabilistic risk-reward management to maintain long-term profitability.
Key Takeaways
- Chartists are market operators who analyze price charts, volume, and technical formations to time trading decisions.
- The philosophy is grounded in three principles: price discounts all information, prices move in trends, and human behavioral patterns repeat.
- The toolkit encompasses geometric chart formations, Japanese candlesticks, mathematical momentum indicators, and support/resistance structure.
- While fundamental analysis identifies broad macroeconomic valuation, chartism provides precise entry, exit, and risk-management thresholds.
- Understanding chart patterns allows traders to anticipate institutional order flow clusters and protect capital against volatile reversals.
Frequently Asked Questions
Can you be a profitable trader using only charts without knowing the news?
Yes. Many professional price action traders, high-frequency scalpers, and systematic algorithmic models operate purely on technical chart parameters and order book flow without reading macroeconomic news releases, though they generally avoid opening new positions immediately ahead of high-volatility news events.
What is the most reliable chart pattern for beginners?
While no pattern is 100% reliable, classical break-and-retest setups around major multi-touch support and resistance levels offer some of the highest statistical probability and cleanest risk-reward ratios in foreign exchange trading.
Why do chartists use multiple timeframes?
Multi-timeframe analysis allows chartists to avoid the “myopia trap.” A trader might look at the Daily or 4-Hour chart to establish the overarching macro trend, and then drop down to the 15-Minute or 5-Minute chart to find an optimal low-risk entry aligned with that major trend.
What is the difference between a “chartist” and a “quantitative trader”?
A chartist typically analyzes visual chart formations, geometric trendlines, and discretionary price action patterns. A quantitative trader (“quant”) translates price and volume time series into formal statistical algorithms, econometric equations, and automated execution code without looking at graphical visual charts.
Ready to trade forex?
Open a free demo account with a regulated broker. Practice with virtual funds before risking real money.