Elliott Wave Theory
Elliott Wave Theory is a technical analysis framework positing that market price action advances and corrects in repetitive, fractal wave structures governed by shifts in collective human crowd psychology, organized into five motive waves and three corrective waves.
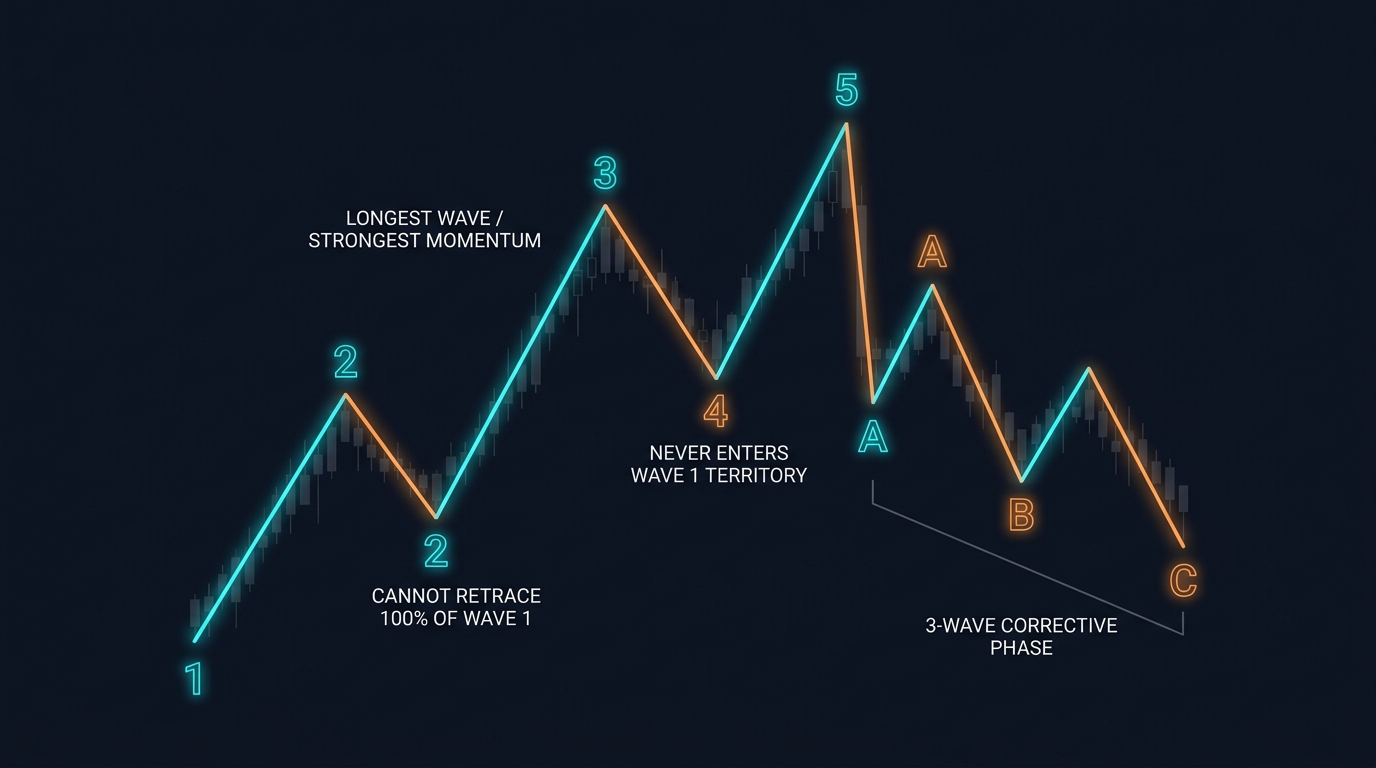
What Is Elliott Wave Theory?
Developed in the late 1930s by professional accountant and market analyst Ralph Nelson Elliott, Elliott Wave Theory is a technical analysis paradigm based on the premise that financial market prices do not move chaotically, but in distinct, repetitive, and measurable cycles. Elliott discovered that swings in collective human psychology—alternating rhythmically between optimism and pessimism, greed and fear—naturally produce recognizable geometric price patterns across all financial markets.
A central tenet of Elliott Wave Theory is its fractal nature: wave patterns replicate their internal geometry regardless of the timeframe examined. A complete wave cycle visible on a monthly macro chart is composed of smaller sub-waves visible on daily, hourly, and minute charts, allowing currency traders to apply identical analytical principles across both multi-year macro trends and intraday scalping setups.
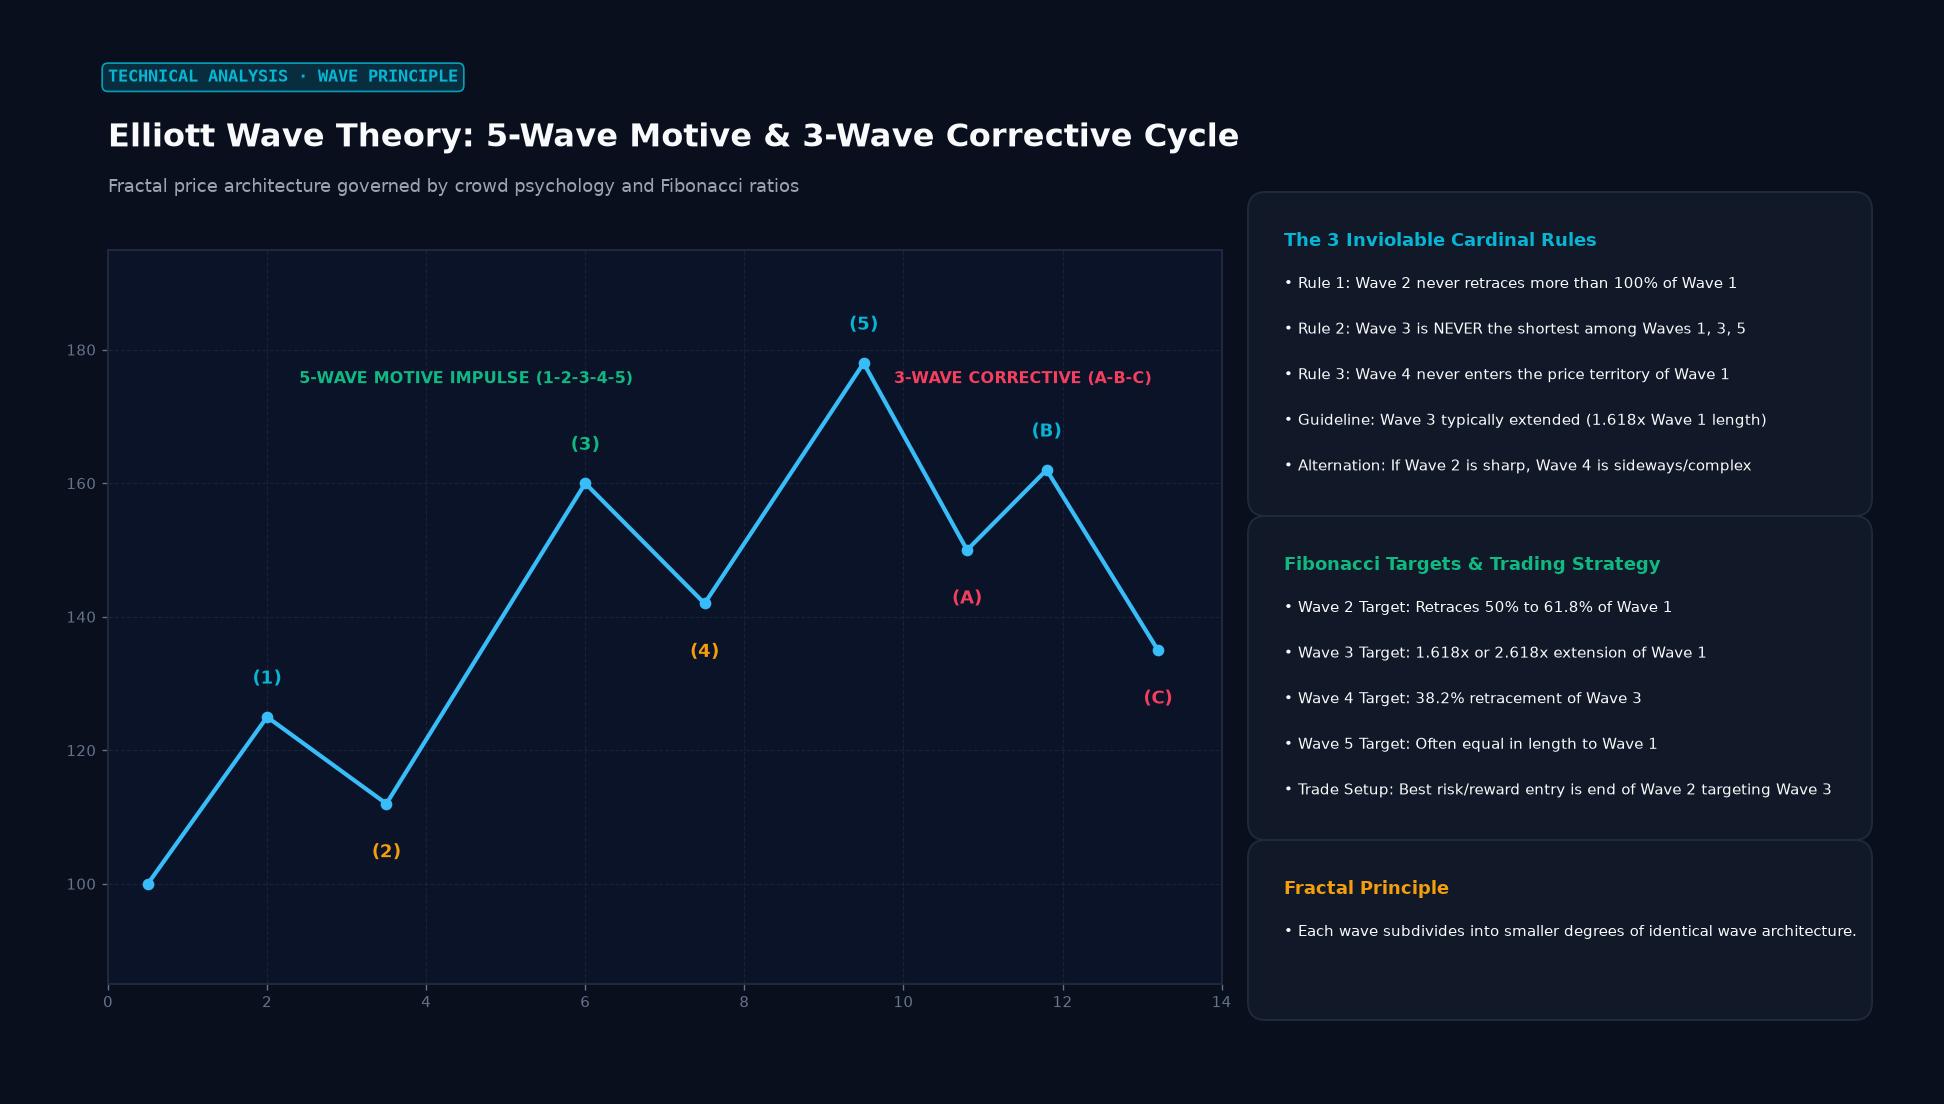 Figure: Fractal price architecture governed by crowd psychology and Fibonacci ratios
Key Takeaways
- The Complete 8-Wave Cycle: A standard trend cycle consists of five motive (impulse) waves numbered 1 through 5 that establish direction, followed by three corrective waves labeled A, B, and C that consolidate prior gains.
- Three Inviolate Rules: For an Elliott Wave count to be technically valid, it must satisfy three cardinal rules without exception. Breaking any single rule completely invalidates the wave count.
- Fibonacci Integration: Wave amplitudes and retracement depths are intrinsically tied to Fibonacci ratios, specifically 38.2%, 50.0%, 61.8%, 100%, and 161.8%.
- Trading Application: In foreign exchange trading, the highest-probability, highest-reward setups occur when entering at the conclusion of Wave 2 (to ride the powerful Wave 3) or at the completion of Wave 4.
The Three Cardinal Inviolate Rules
To prevent subjective curve-fitting, Ralph Nelson Elliott established three non-negotiable rules for standard impulse waves:
| Rule | Description | Structural Rationale |
|---|---|---|
| Rule 1: Wave 2 Retracement | Wave 2 can never retrace more than 100% of Wave 1. | If price drops below the starting point of Wave 1, the prior advance was not an impulse wave but part of an ongoing downtrend. |
| Rule 2: Wave 3 Length | Wave 3 is never the shortest among the three motive waves (Waves 1, 3, and 5). | Wave 3 represents the most powerful institutional participation phase with peak momentum and volume; it cannot be the smallest leg. |
| Rule 3: Wave 4 Overlap | Wave 4 cannot enter the price territory of Wave 1 (except in diagonal triangles). | Motive momentum must keep pullbacks contained above prior structural breakout peaks to sustain institutional conviction. |
The Complete 8-Wave Anatomy
Motive Phase (Waves 1 to 5)
- Wave 1: Initial accumulation. Institutional “smart money” enters at deeply discounted valuations, often following prolonged pessimism.
- Wave 2: First corrective pullback. Fearful participants take quick profits or test lows; typically retraces 50.0% to 61.8% of Wave 1 on declining volume.
- Wave 3: The powerhouse move. Fundamental data turns positive, retail traders jump in, and breakout algorithms trigger. Wave 3 commonly extends to 161.8% or 261.8% of the length of Wave 1.
- Wave 4: Profit-taking consolidation. Typically retraces 38.2% of Wave 3 and tends to be complex, choppy, and prolonged (often forming triangles or flags).
- Wave 5: Final speculative blow-off. Price makes a new high, but momentum indicators (RSI or MACD) show marked bearish divergence as institutional participation wanes.
Corrective Phase (Waves A, B, and C)
- Wave A: Initial breakdown often mistaken for a standard dip in the ongoing bull market.
- Wave B: Bear-market “bull trap” rally. Price rallies toward previous highs, retracing 50% to 78.6% of Wave A, but lacks volume.
- Wave C: Devastating capitulation wave. Downside momentum accelerates, breaking below the low of Wave A, often reaching parity (100%) or 161.8% of Wave A.
Practical FX Trading Strategy: Trading the Wave 3 Breakout
Foreign exchange pairs (such as EUR/USD or GBP/JPY) exhibit strong trending characteristics ideal for Wave 3 execution:
Trading Setup at the Wave 2 Completion:
1. Identify 5 clear sub-waves forming Wave 1 off major support.
2. Monitor Wave 2 pullback for a 3-wave (a-b-c) corrective structure into the 61.8% Fibonacci retracement level.
3. Place Buy Stop order just above the local minor swing high.
4. Set Hard Stop-Loss 1 pip below the invalidation level (the start of Wave 1).
5. Project Take-Profit targets at 161.8% extension of Wave 1.
Frequently Asked Questions
Why is Elliott Wave Theory criticized as overly subjective?
The primary critique from quantitative economists and retail skeptics is that two independent wave analysts looking at the exact same price chart can produce completely contradictory wave counts. Because complex corrections introduce numerous permutations (flats, zigzags, expanding triangles, double threes), analysts frequently revise counts after the fact (“hindsight bias”), making purely discretionary wave counting difficult to backtest systematically.
What is the “Rule of Alternation”?
The Rule of Alternation states that if Wave 2 in an impulse cycle is a sharp, deep, simple correction (e.g., a fast 61.8% zigzag), Wave 4 is highly likely to be a shallow, sideways, complex correction (e.g., a prolonged flat or symmetrical triangle), and vice versa. This guideline helps traders anticipate the structure and duration of subsequent pullbacks.
Can Elliott Wave be used in intraday 5-minute or 15-minute currency trading?
Yes, due to its fractal nature, wave patterns manifest across short timeframes. However, intraday charts are subject to higher market microstructure noise, algorithmic bid-ask liquidity shocks, and spread spikes during economic releases, which frequently produce false wave breakouts compared to daily and 4-hour charts.
Ready to trade forex?
Open a free demo account with a regulated broker. Practice with virtual funds before risking real money.