Envelopes
Moving Average Envelopes are technical overlay bands plotted at fixed percentage distances above and below a baseline moving average, establishing dynamic support and resistance channels to identify overbought and oversold market conditions.
What Are Moving Average Envelopes?
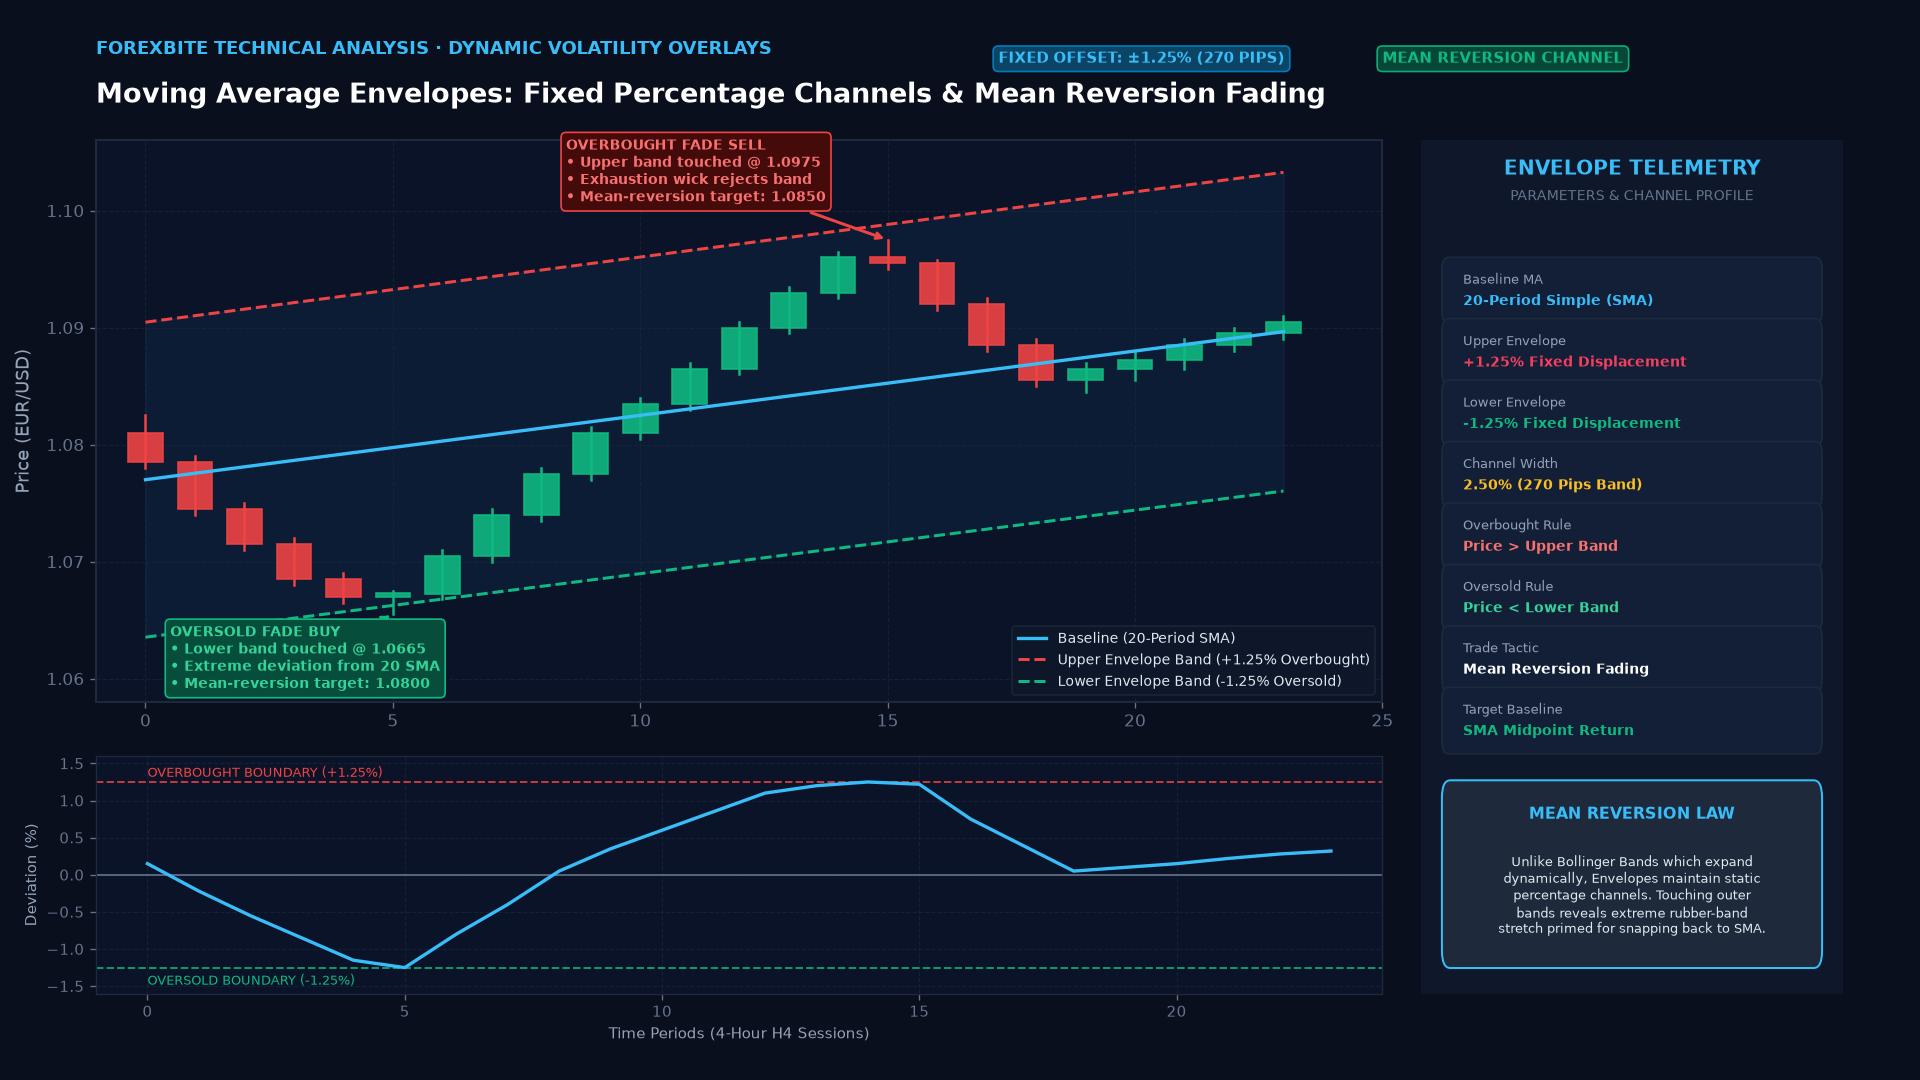
Moving Average Envelopes (commonly referred to simply as Envelopes) are a classic technical indicator plotted directly over the price series of a financial asset. An envelope consists of three lines: a central moving average baseline (such as a 20-day Simple Moving Average or Exponential Moving Average), flanked by an Upper Envelope Band and a Lower Envelope Band shifted vertically by a fixed percentage.
The foundational concept behind envelopes is the principle of mean reversion. Market prices rarely travel away from their average in a straight line without returning. By encapsulating normal price action within a defined upper and lower boundary, envelopes allow foreign exchange traders to visually spot extreme price deviations, locate dynamic support and resistance zones, and generate high-probability trading signals during both trending and ranging market regimes.
Key Takeaways
- Fixed Percentage Offset: Unlike Bollinger Bands which expand and contract based on statistical volatility (standard deviations), envelopes use a fixed percentage deviation (e.g., $\pm 1%$ or $\pm 2.5%$).
- Dual Strategic Utility: Envelopes serve two distinct trading methodologies: mean-reversion fading when prices touch bands in ranging markets, and breakout momentum when prices forcefully penetrate bands during strong news-driven trends.
- Dynamic Support and Resistance: Because the bands shift smoothly with the underlying moving average, they provide evolving price levels rather than static horizontal lines.
- Pair-Specific Calibration: The optimal percentage width must be tailored to the specific asset’s volatility; stable major pairs like EUR/USD require tighter envelope bands than volatile crosses like GBP/JPY.
Mathematical Formulation
Constructing a Moving Average Envelope requires defining two core parameters: the moving average lookback period ($n$) and the percentage displacement factor ($k%$):
- Baseline Moving Average: $$\text{Baseline}t = \text{SMA}n(P_t) = \frac{1}{n} \sum{i=0}^{n-1} P{t-i}$$
- Upper Envelope Band: $$\text{Upper Band}_t = \text{Baseline}_t \times \left(1 + \frac{k}{100}\right)$$
- Lower Envelope Band: $$\text{Lower Band}_t = \text{Baseline}_t \times \left(1 - \frac{k}{100}\right)$$
Example: If the 20-day SMA of EUR/USD sits at 1.0800, and a trader selects a $1.0%$ envelope offset:
- $\text{Upper Band} = 1.0800 \times (1 + 0.01) = 1.0908$
- $\text{Lower Band} = 1.0800 \times (1 - 0.01) = 1.0692$
Envelopes vs. Bollinger Bands vs. Keltner Channels
Technical chartists often confuse envelopes with other channel-based indicators. The defining difference lies in how band widths are computed:
| Feature | Moving Average Envelopes | Bollinger Bands | Keltner Channels |
|---|---|---|---|
| Band Spacing Method | Fixed mathematical percentage ($k%$) | Statistical standard deviation ($\sigma \times 2$) | Average True Range ($\text{ATR} \times 2$) |
| Response to Volatility | Rigid and constant width relative to price level | Dynamically expands during breakouts, squeezes during quiet phases | Expands/contracts smoothly based on candle range |
| Best Market Regime | Stable, mean-reverting, range-bound currency pairs | Volatility breakout anticipation and trend acceleration | Smooth trend-following and trailing stop placement |
| Typical Parameters | 20-period SMA / EMA, $\pm 0.5%$ to $3.0%$ | 20-period SMA, 2.0 Standard Deviations | 20-period EMA, 2.0 ATR (10-period) |
Two Core Trading Strategies
1. Counter-Trend Mean Reversion (Ranging Markets)
When an ADX (Average Directional Index) indicator reads below 20, the currency pair is in a consolidation phase.
- Buy Setup: Price dips below the Lower Envelope Band, followed by a bullish reversal candlestick (e.g., a hammer or pin bar) closing back inside the envelope. Target: Central Moving Average. Stop-loss: 15–20 pips below the swing low.
- Sell Setup: Price spikes above the Upper Envelope Band and closes back within the channel. Target: Central Moving Average.
2. Trend-Following Breakout (High-Momentum Regimes)
When a high-impact macroeconomic catalyst occurs:
- Bullish Breakout: A daily candle decisively closes above the Upper Envelope Band accompanied by expanding volume. Instead of shorting, the trader enters a long position, treating the envelope penetration as confirmation of an emerging multi-week directional trend.
Frequently Asked Questions
What are the best default settings for envelopes in forex?
For daily (D1) charts on major currency pairs (EUR/USD, USD/CAD), a 20-day SMA with a 1.0% to 1.5% envelope captures roughly 85% to 90% of price action. For intraday 1-hour (H1) charts, traders typically tighten the offset to 0.25% to 0.50% to account for smaller intraday trading ranges.
How do I prevent false signals when trading envelope mean-reversion?
Never trade envelope touches in isolation during strong news releases or central bank days. Always pair envelopes with a secondary momentum oscillator like the Relative Strength Index (RSI) or Stochastic Oscillator to look for clear multi-timeframe divergence before entering counter-trend positions.
Can envelopes be constructed using Exponential Moving Averages (EMA)?
Yes. Many short-term swing traders prefer an EMA-based envelope (e.g., 20-period EMA) because EMAs weight recent price candles more heavily than historical ones, allowing the envelope boundaries to respond faster to recent price turns.
Ready to trade forex?
Open a free demo account with a regulated broker. Practice with virtual funds before risking real money.