Cup with Handle
A cup with handle (cup and handle) is a classic bullish technical continuation chart pattern where an asset forms a rounded 'U-shaped' consolidation followed by a slight downward-drifting handle before breaking out.
What Is the Cup with Handle Pattern?
The cup with handle (commonly termed the cup and handle) is one of the most reliable and widely recognized bullish continuation patterns in technical analysis. First popularized by legendary growth investor William J. O’Neil in his 1988 classic How to Make Money in Stocks, the formation visualizes a multi-week or multi-month battle of accumulation between buyers and institutional sellers.
The pattern resembles the silhouette of a standard teacup in profile, consisting of two structural components:
- The Cup: A prior uptrend encounters resistance at a swing high (the left rim), undergoes an orderly, rounded U-shaped correction as weak-handed retail traders are gradually shaken out, and steadily recovers back up to the prior high (the right rim).
- The Handle: A short, tight, downward-sloping or horizontal consolidation channel in the upper third of the pattern, representing a final, low-volume shakeout of remaining impatient sellers before price breaks out above the rim line.
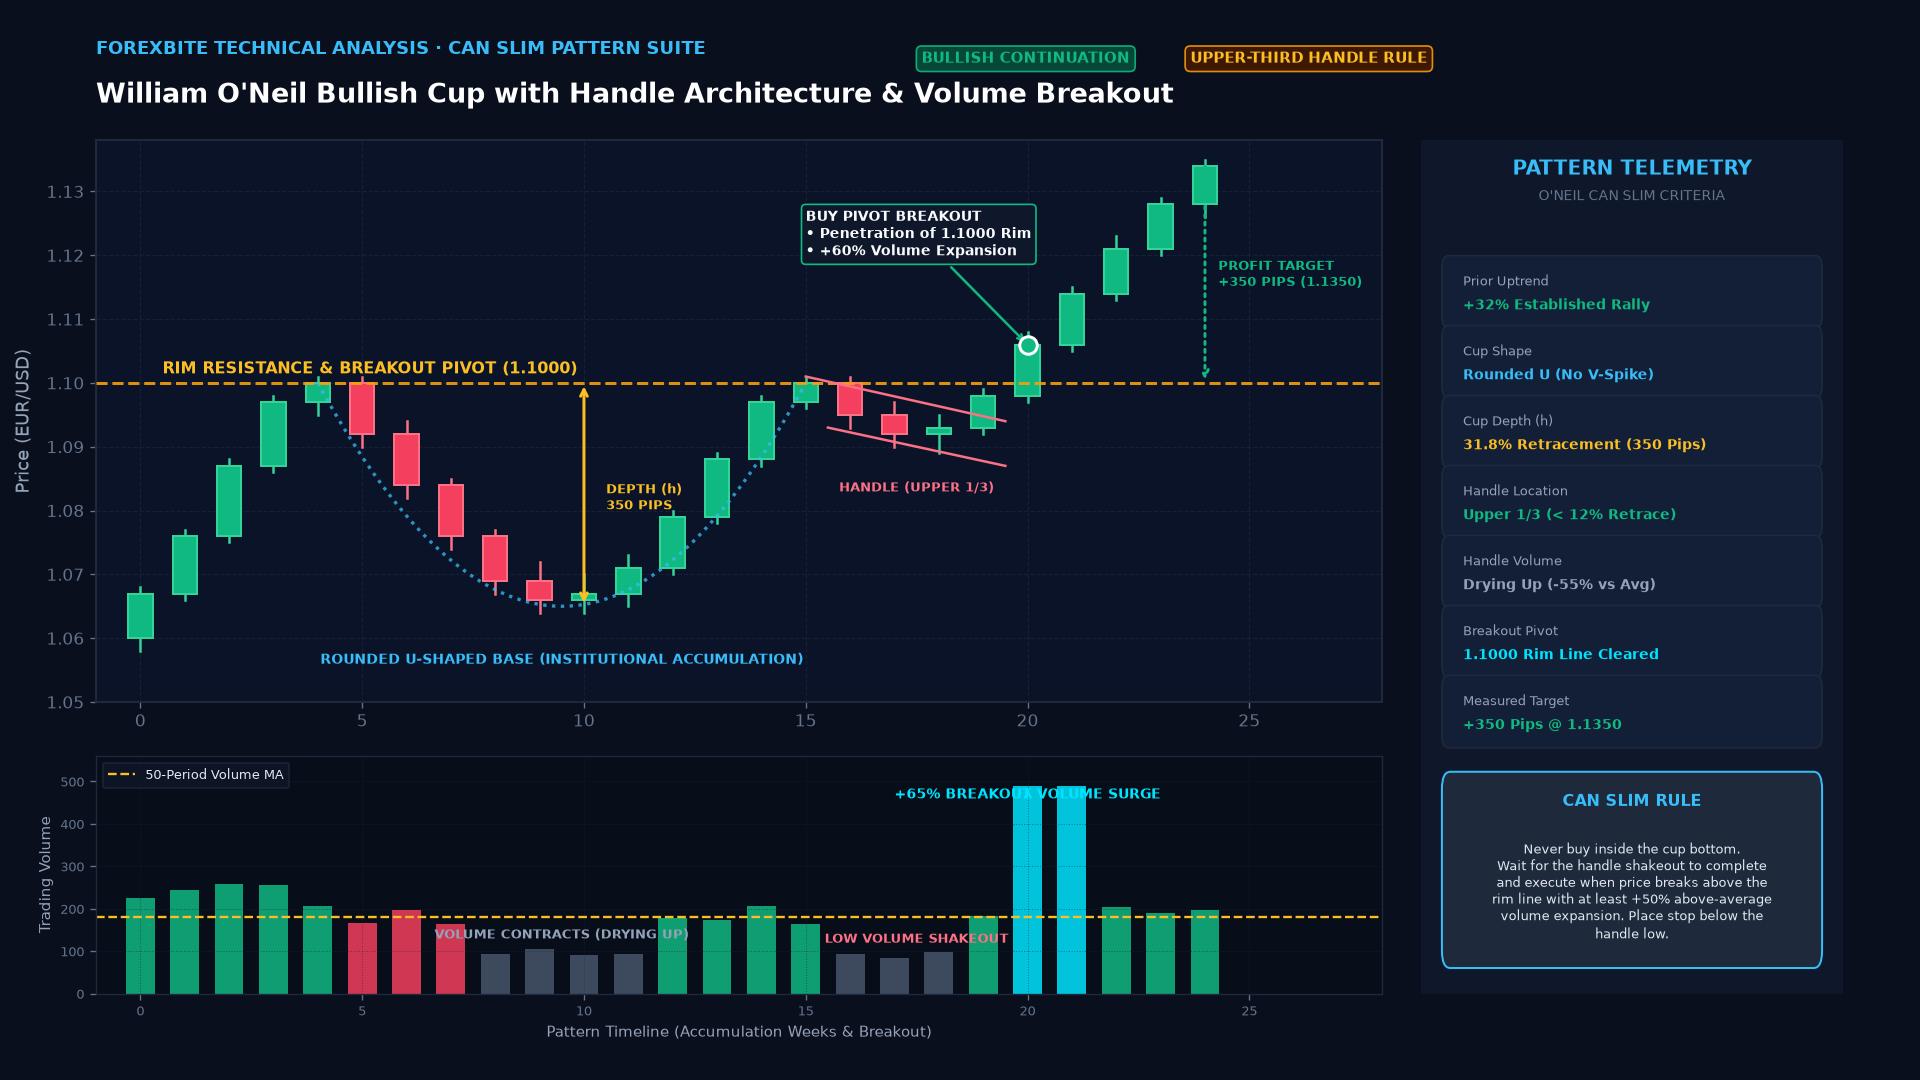 Figure: William O’Neil Cup with Handle bullish continuation pattern illustrating the rounded U-shaped accumulation base, upper-third handle shakeout, volume contraction, and +60% breakout volume surge.
Key Takeaways
- U-Shaped Architecture: A valid cup must exhibit a smooth, rounded bottom reflecting institutional accumulation over time; sharp “V-shaped” bottoms are disqualified as they lack structural base-building.
- The Upper-Third Rule: The handle must form strictly within the upper third to half of the entire cup structure; a handle that droops into the lower half of the cup indicates excessive selling pressure and pattern failure.
- Volume Signature: Volume must dry up dramatically during the bottom of the cup and throughout the handle consolidation, followed by an explosive surge in volume (at least 40% to 50% above average) on the breakout above the rim.
- Measured Move Objective: The minimum technical profit target is calculated by measuring the vertical depth of the cup from the rim line to the lowest point of the trough, projected upward from the breakout point.
Technical Rules for Pattern Validation
To prevent entering false formations, professional technicians require the pattern to meet strict mathematical parameters:
| Structural Element | Classical O’Neil Criteria | Modern Forex & Crypto Adaptation |
|---|---|---|
| Prior Trend | Minimum +30% established prior uptrend | Clear multi-week impulse rally on Daily/4H charts |
| Cup Depth | Corrects 12% to 33% (up to 50% in volatile markets) | Typically retraces 38.2% to 61.8% of the prior impulse wave |
| Cup Shape | Rounded “U” shape lasting 7 to 65 weeks | U-shaped bottom lasting 3 weeks to several months |
| Handle Depth | Retraces 8% to 12% from the right rim high | Downward drift capped at < 38.2% of the cup depth |
| Handle Duration | Lasts 1 to 4 weeks | Lasts 5 to 15 trading days (or 20–40 candles on 4H) |
| Breakout Trigger | Daily close above the highest peak of the handle/rim | Candle close above rim accompanied by volume expansion |
The Psychology of the Cup and Handle Lifecycle
The power of the pattern lies in its psychological sequence:
- Left Rim & Resistance: Price hits a major resistance level and encounters institutional profit-taking.
- The Descent: Uncommitted buyers exit as price slides lower. Crucially, the selling is orderly, not panicked.
- The Bottom (Accumulation): At the base of the “U”, smart-money institutional desks quietly absorb selling pressure at bargain prices, causing volatility and volume to dry up completely.
- The Ascent: Price steadily recovers toward the previous high as buyers regain control.
- The Handle (Final Shakeout): As price approaches the left rim, traders who bought at the prior peak and sat through the drawdown are desperate to “get out at breakeven.” Their selling creates a small, tight pullback (the handle).
- The Breakout: Once all breakeven sellers are absorbed and selling volume vanishes, buyers effortlessly overwhelm remaining offers, driving an aggressive breakout rally.
Real-World Case Study: Trading a Cup with Handle on AUD/USD
Consider a daily chart setup on the Australian Dollar against the U.S. Dollar (AUD/USD).
Formation Chronology:
- Left Rim: AUD/USD reaches a cycle peak at
0.6800before pulling back. - Cup Trough: Over six weeks, the pair forms an orderly rounded base, bottoming at
0.6500(a 300-pip cup depth, retracing exactly 50% of its preceding rally). - Right Rim: AUD/USD recovers smoothly back to
0.6800. - The Handle: Price pulls back in a narrow, downward-sloping 50-pip channel between
0.6800and0.6750over eight trading sessions. Daily trading volume drops to a monthly low. - The Breakout: Following strong Australian employment and Chinese manufacturing data, AUD/USD breaks above
0.6800on expanding volume, closing the day at0.6820.
Trade Execution & Risk Management:
- Entry: Long at
0.6825on the confirmation candle close above the rim. - Stop-Loss: Placed just below the lowest point of the handle at
0.6740(85 pips risk). - Measured Move Target Calculation: $$\text{Cup Depth} = 0.6800 - 0.6500 = 300 \text{ pips}$$ $$\text{Profit Target} = \text{Breakout Level} (0.6800) + 300 \text{ pips} = 0.7100$$
- Outcome: AUD/USD advances steadily over the subsequent eight weeks, reaching
0.7100and delivering a 3.5:1 reward-to-risk return.
The Inverted Cup with Handle (Bearish Reversal)
The pattern also functions in reverse as a bearish continuation or distribution structure:
- The “Inverted Cup” forms an upside-down rounded dome ($\cap$-shape) where price struggles to rally and slowly rolls over.
- The “Inverted Handle” is a minor upward-sloping retracement drifting toward the dome ceiling.
- A breakdown below the horizontal support neckline triggers a sharp bearish cascade with a downside measured-move objective equal to the dome’s height.
Frequently Asked Questions
What invalidates a cup with handle pattern?
A cup with handle is invalidated if:
- The bottom is sharp and V-shaped (indicating erratic whipsaw rather than steady accumulation).
- The handle drifts downward below the midpoint (50%) of the cup base.
- The handle slopes upward (an ascending wedge handle indicates premature retail buying and often breaks down).
- The breakout occurs on low, below-average volume.
Can the handle break out downward?
Yes. If macroeconomic headwinds overpower the formation, price will break down through the lower trendline of the handle rather than breaking out above the rim. When this occurs, the pattern is aborted, and traders should not enter.
How does a trader use moving averages with this pattern?
In a textbook setup, the bottom of the cup often finds dynamic support near the 200-day Simple Moving Average (SMA), while the handle consolidation typically rests directly upon the rising 50-day SMA, confirming structural alignment across multiple timeframes.
Ready to trade forex?
Open a free demo account with a regulated broker. Practice with virtual funds before risking real money.