Cover on a Bounce
Cover on a bounce is a reactive technical exit strategy where a short seller holds their position through a test of major support, liquidating (covering) only after price confirms an upward rejection or bounce.
What Is Cover on a Bounce?
Cover on a bounce is a reactive trade-management strategy used by short sellers in financial and foreign exchange markets. Unlike cover on approach—where a trader preemptively liquidates a short position before price reaches a support zone—cover on a bounce requires the trader to wait for the price to actively test support and observe market behavior. If the support level holds and price visibly rebounds (bounces) upward, the trader immediately buys back the asset to exit the trade.
The core motivation behind covering on a bounce is to maximize profit potential: by holding the position through the initial test of support, the trader preserves the opportunity to capture an explosive trend continuation if the support level completely collapses. If the support floor instead proves impenetrable, the trader accepts sacrificing a modest portion of peak unrealized gains from the trough to safely exit on the confirmed rebound.
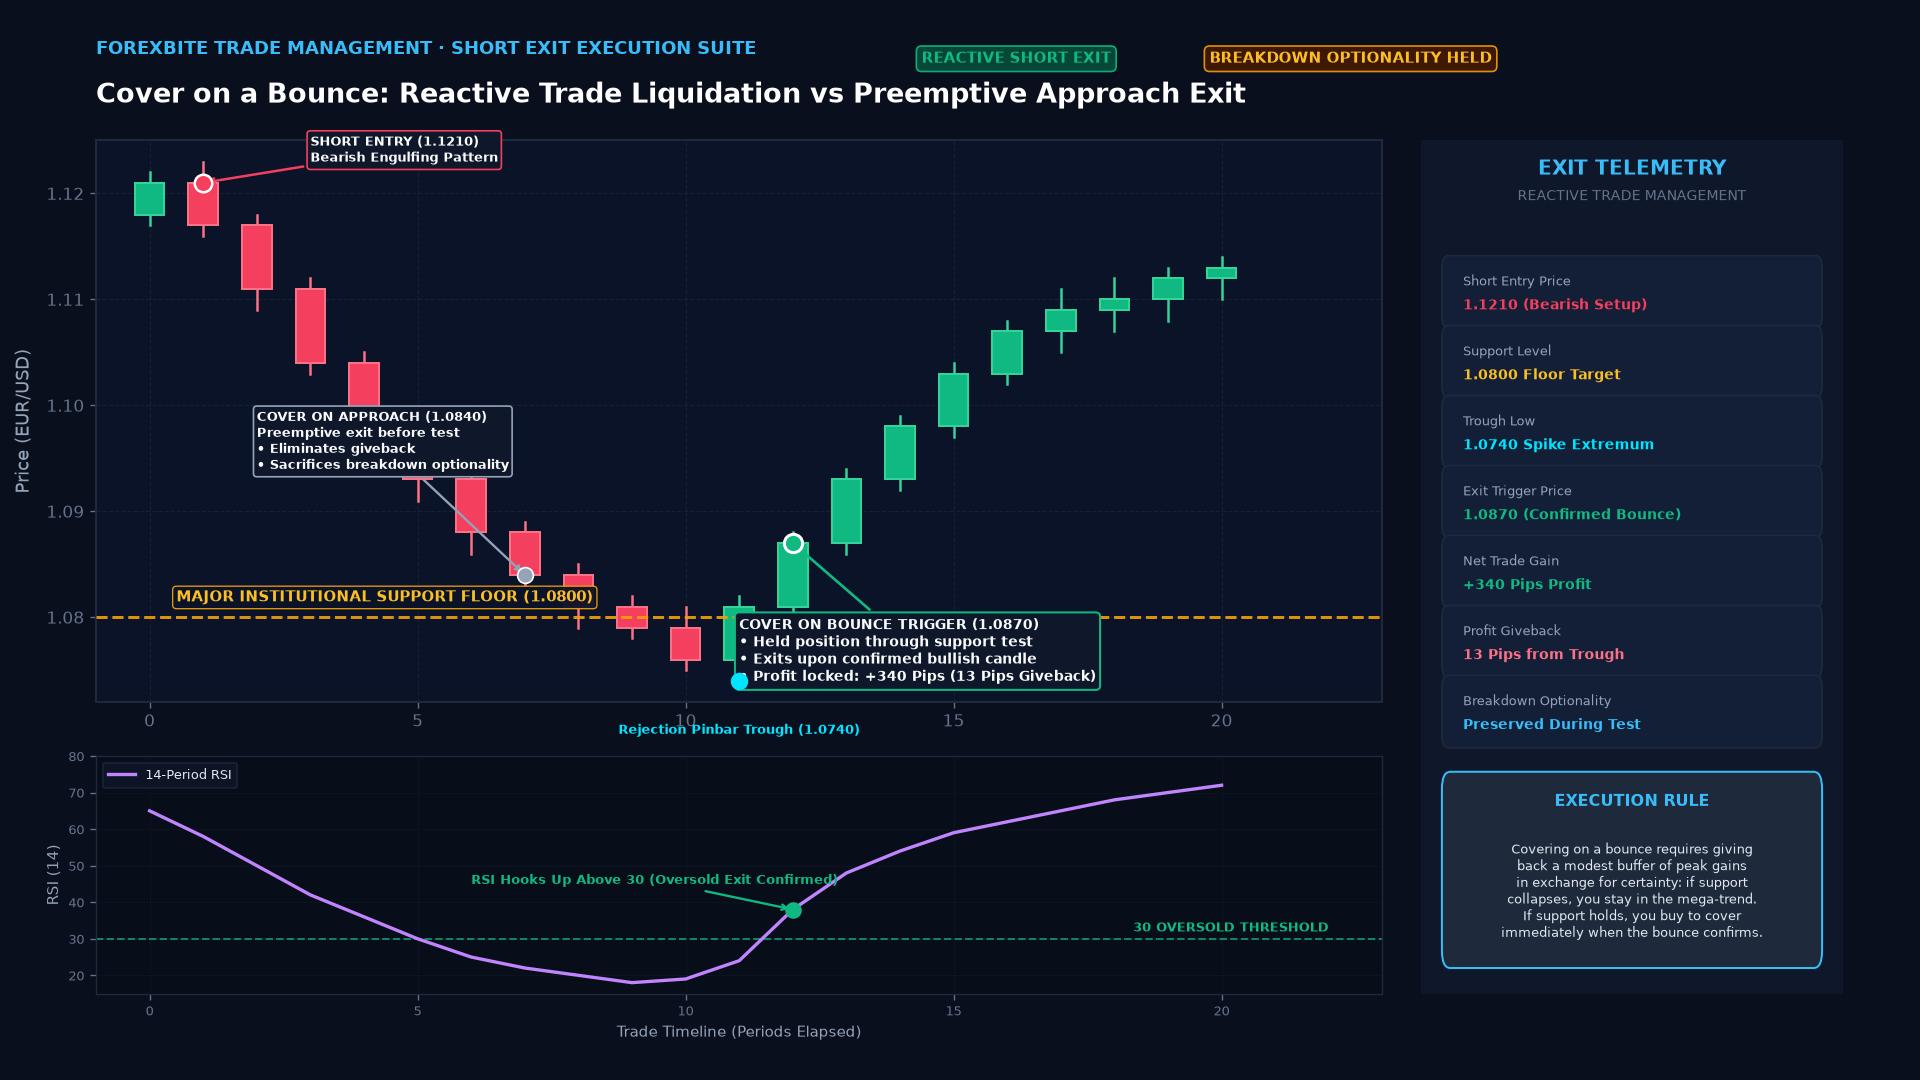 Figure: Reactive Cover on a Bounce exit strategy contrasting preemptive Cover on Approach against confirmed bounce execution (1.0870) following a rejection hammer pinbar at support.
Key Takeaways
- Reactive vs. Preemptive: The trader acts in response to confirmed price action rather than anticipating or guessing what will occur at support.
- Breakout Optionality: Holding through the support test allows the trader to participate in catastrophic breakdown moves without having closed the position prematurely.
- The “Giveback” Cost: The primary trade-off is the necessity of surrendering a portion of maximum floating profit (the distance between the absolute low of the test and the confirmation point of the bounce).
- Trigger Signals: Technicians validate a genuine bounce using lower-timeframe reversal candlesticks (such as pin bars or engulfing candles), volume divergence, or an upward cross on momentum oscillators (RSI, Stochastic).
Technical Signals for Confirming a Support Bounce
Exiting on a bounce does not mean closing the trade on the first random tick upward. Professional traders wait for objective structural confirmation:
| Confirmation Indicator | Technical Signal | Operational Action |
|---|---|---|
| Candlestick Rejection | A long lower shadow (wick) forming a Hammer or Bullish Pin Bar at support | Indicates institutional absorption; prepare market buy order |
| Micro-Structure Break | 5-minute or 15-minute chart breaks above the previous swing high | Confirms short-term order flow has flipped from net-selling to net-buying |
| Momentum Hook | Relative Strength Index (RSI) hooks upward out of the oversold zone (< 30) | Validates seller exhaustion; execute immediate cover order |
| Volume Absorption | A massive volume spike at support that fails to push price lower | Signals smart-money passive accumulation; exit short immediately |
Comparative Analysis: Cover on Approach vs. Cover on a Bounce
Traders choose between these two core exit philosophies depending on whether they prioritize execution certainty or trend maximization:
| Feature | Cover on Approach | Cover on a Bounce |
|---|---|---|
| Order Type Used | Passive Limit Order (Maker) | Aggressive Market Order or Stop Order (Taker) |
| Profit Realization | Locks in near-maximum gains before support | Gives back 10% to 25% of gains from the lowest low |
| Breakout Capture | 0% (Position is closed before breakout can occur) | 100% (Position stays open if support fails) |
| Slippage Exposure | Negligible; executes into deep resting bids | Moderate to high; buying into an active upward rebound |
| Market Regime Suitability | Sideways consolidation ranges, low liquidity | Strong macro trends, high volatility, news catalysts |
Real-World Case Study: Managing a Short USD/JPY Trade
A swing trader enters a short position of 3 standard lots in USD/JPY at 156.50 following hawkish forward guidance from the Bank of Japan.
The Setup:
- Major Support Level: A critical horizontal daily support zone sits at
154.00(representing 250 pips of unrealized profit). - The Objective: Capture an extended breakdown if 154.00 fails, but exit swiftly if buyers defend the level.
Execution Chronology:
- The Support Test: Price cascades downward to touch
154.02. Floating profit peaks at +248 pips ($4,800 USD). Rather than covering, the trader holds to observe price action. - The Rejection: Instead of slicing through 154.00, price hesitates. A 15-minute hammer candle forms with a 25-pip lower shadow.
- The Bounce Confirmation: Two consecutive 5-minute bullish candles push price up to
154.22, breaking above the local consolidation high. - Execution: The trader triggers an immediate market buy order to cover the 3 lots at 154.24.
- The Accounting:
- Entry: 156.50
- Exit: 154.24
- Net Profit Realized: +226 pips ($4,400 USD)
- Profit Given Back: 22 pips ($400 USD) from the absolute low.
- Subsequent Market Move: Relieved of selling pressure, USD/JPY rallies over the next 48 hours back to 155.80. By covering on the bounce, the trader successfully protected $4,400 of their $4,800 peak profit.
Trailing Stop Mechanism for Automating the Bounce Exit
Traders who cannot sit in front of the charts 24 hours a day automate this exit using a Trailing Stop activated only upon reaching support:
$$\text{Trailing Exit Trigger} = \text{Trough Price} + (\text{Lookback Swing High} \text{ or } 1.5 \times \text{ATR})$$
Once price pierces the target threshold near support, the automated trading system pins a tight trailing stop behind the price. If price continues dropping, the trailing stop ratchets lower, locking in additional gains. The moment price rebounds upward by more than the specified buffer, the stop triggers, executing the cover on a bounce automatically.
Frequently Asked Questions
What is the primary risk of waiting to cover on a bounce?
The primary risk is a short squeeze. When a heavily shorted asset bounces off a major support level, hundreds of short sellers rush to buy back contracts simultaneously while new technical buyers enter the market. This concentrated demand can create an explosive upward spike, causing severe slippage and wiping out a large percentage of open profits within seconds.
Can this concept be applied to exiting long positions?
Yes. When managing a long position, the identical strategy is termed “Selling on a Dip / Selling on a Reversal” from resistance. The trader holds through overhead resistance hoping for a breakout, but liquidates if price hits the ceiling and bounces downward.
How many pips should a trader allow for a bounce before covering?
The bounce tolerance depends on the timeframe and the asset’s volatility. On a 1-hour or 4-hour chart, professional traders typically allow a bounce of 0.5x to 1.0x the 1-hour Average True Range (ATR) (approximately 15 to 30 pips on major currency pairs) before concluding that the support level has definitively held.
Ready to trade forex?
Open a free demo account with a regulated broker. Practice with virtual funds before risking real money.