Lagging Indicator
A lagging indicator is a technical or macroeconomic metric that trails price action or economic performance, changing only after a significant trend or structural shift has already been established.
What Is a Lagging Indicator?
A lagging indicator is a measurable financial or economic statistic that follows rather than anticipates market movements. Unlike predictive tools that attempt to forecast future price pivots, lagging indicators change only after the broader economy or underlying asset price has already established a clear directional trend.
In trading and economics, lagging indicators serve as validation instruments. While they do not alert participants to initial turning points, they provide high-probability confirmation that a genuine macroeconomic shift or technical breakout is underway, helping market participants distinguish sustainable long-term trends from erratic market noise.
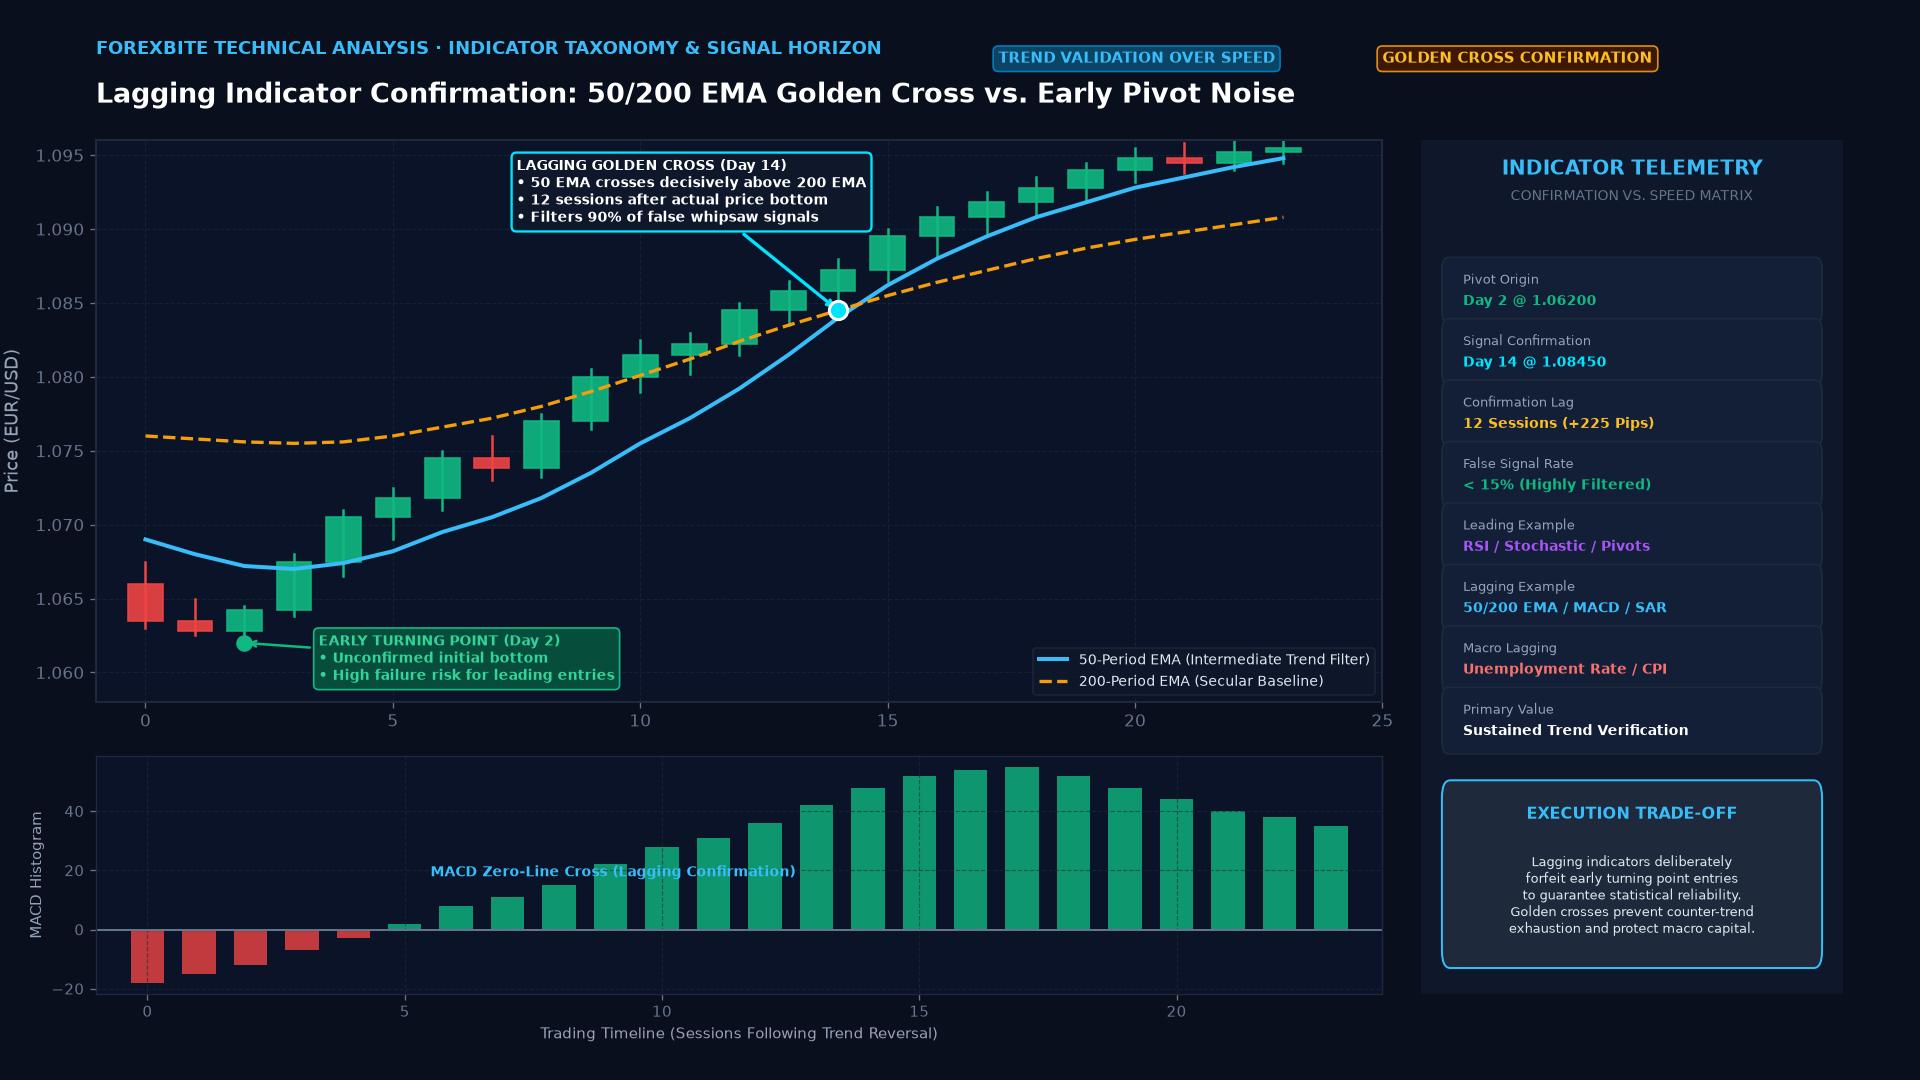
Dual Applications: Technical Analysis vs. Macroeconomics
The concept of a lagging indicator operates across two distinct domains of financial analysis:
1. Technical Analysis (Chart Indicators)
Technical lagging indicators are mathematical formulas calculated from historical closing prices over specified lookback periods:
- Simple and Exponential Moving Averages (50/200 SMA): Because moving averages average past prices, they lag current price action. A 50-day SMA crossing above a 200-day SMA (Golden Cross) confirms a bull market that began weeks earlier.
- Moving Average Convergence Divergence (MACD): The MACD histogram and signal line crossovers lag underlying price turns, serving to confirm momentum continuation.
- Parabolic SAR: Trails trending price action, flipping position only after a confirmed reversal has occurred.
2. Macroeconomics (Fundamental Analysis)
Economic lagging indicators measure the delayed consequences of earlier business cycle shifts:
- Unemployment Rate: Corporations do not lay off staff or hire aggressively at the first hint of economic change. Hiring freezes and layoffs occur quarters after an economic slowdown begins.
- Consumer Price Index (CPI): Inflation is a lagging reflection of past monetary expansion, wage growth, and supply chain shocks.
- Corporate Earnings: Quarterly financial earnings reports document revenue and profit earned over past operational quarters.
Lagging Indicators vs. Leading Indicators
| Characteristic | Lagging Indicators | Leading Indicators |
|---|---|---|
| Timing | Trailing; confirms past movements | Predictive; anticipates future turns |
| Primary Function | Validates trend persistence and strength | Identifies potential turning points and tops/bottoms |
| Reliability | High; minimal false positives in trends | Lower; vulnerable to false breakout whipsaws |
| Execution Speed | Late; enters after move is underway | Early; enters near the origin of price pivots |
| Examples (Technical) | Moving Averages, MACD, Bollinger Bands | RSI, Stochastic Oscillator, Fibonacci Levels |
| Examples (Macro) | Unemployment Rate, CPI, GDP | Yield Curve, Building Permits, ISM New Orders |
The Structural Trade-Off: Reliability vs. Latency
The defining dilemma of lagging indicators is the mathematical trade-off between certainty and execution price:
The Lagging Indicator Cost:
- Advantage: High win rate in strong, persistent macro trends.
- Penalty:   Giving up the first 15% to 25% of a new trend's initial move.
- Danger:    In horizontal, range-bound markets, lagging indicators generate
             repeated false crossover signals (whipsaws), buying near range
             highs and selling near range lows.
How Professional Traders Combine Lagging and Leading Tools
Institutional traders never rely solely on a single indicator category. Instead, they construct multi-layered trading systems that harmonize leading and lagging signals:
- Macro Trend Filter (Lagging): Use a 200-day SMA or daily MACD trend to establish the dominant market direction. If price is above the 200 SMA, the trader establishes an exclusively bullish bias.
- Precision Entry Timing (Leading): Once the bullish trend is confirmed, drop to a 4-hour or 1-hour timeframe and utilize a leading oscillator—such as the Relative Strength Index (RSI) dipping into oversold territory (below 30) or printing bullish divergence—to pinpoint exact pullback entries.
Key Takeaways
- A lagging indicator follows price action or economic activity, confirming established trends.
- Technical examples include Moving Averages and MACD; economic examples include Unemployment and CPI.
- Lagging metrics provide superior noise filtering and trend confirmation at the cost of delayed entry timing.
- In choppy sideways ranges, lagging indicators produce costly false crossover whipsaws.
- Optimal strategy design uses lagging indicators to define macro trend direction and leading indicators to time entries.
Frequently Asked Questions
Why do trend-following funds rely heavily on lagging indicators?
Quantitative trend-following funds (CTAs) manage billions of dollars and cannot enter markets on unpredictable tops and bottoms. They rely on lagging moving average breakout systems to capture the massive, multi-month middle portion of major macroeconomic trends.
Is the Gross Domestic Product (GDP) a lagging indicator?
Yes. Official GDP figures are published weeks or months after a quarter has concluded and are subject to multiple retrospective revisions, documenting past economic output rather than predicting future quarters.
Can lagging indicators be modified to react faster?
Yes. Shortening the lookback period (e.g., using a 9-period EMA instead of a 50-period SMA) reduces indicator lag. However, reducing lag increases noise sensitivity, multiplying the number of false signals.
Ready to trade forex?
Open a free demo account with a regulated broker. Practice with virtual funds before risking real money.