Flat on a Failure
Flat on a failure is an active trade-management and exit discipline mandating that a trader immediately close an open position (go flat) when price action tests a critical support or resistance level but fails to break through with directional conviction.
What Does “Flat on a Failure” Mean?
In technical analysis and active currency trading, “flat on a failure” is an imperative risk-management rule governing trade exits. The rule dictates that if an open winning or speculative position tests a major technical boundary (such as a multi-week resistance ceiling, prior swing high, or critical trendline) and price action exhibits clear signs of rejection or inability to break through, the trader must immediately close the position and return to cash (go flat).
Rather than holding open exposure through what could become a severe, trend-reversing correction—or stubbornly hoping that the market will mount a second breakout attempt—the trader prioritizes capital and profit preservation. By going flat upon the first definitive confirmation of failure, the trader locks in accrued gains and eliminates downside vulnerability.
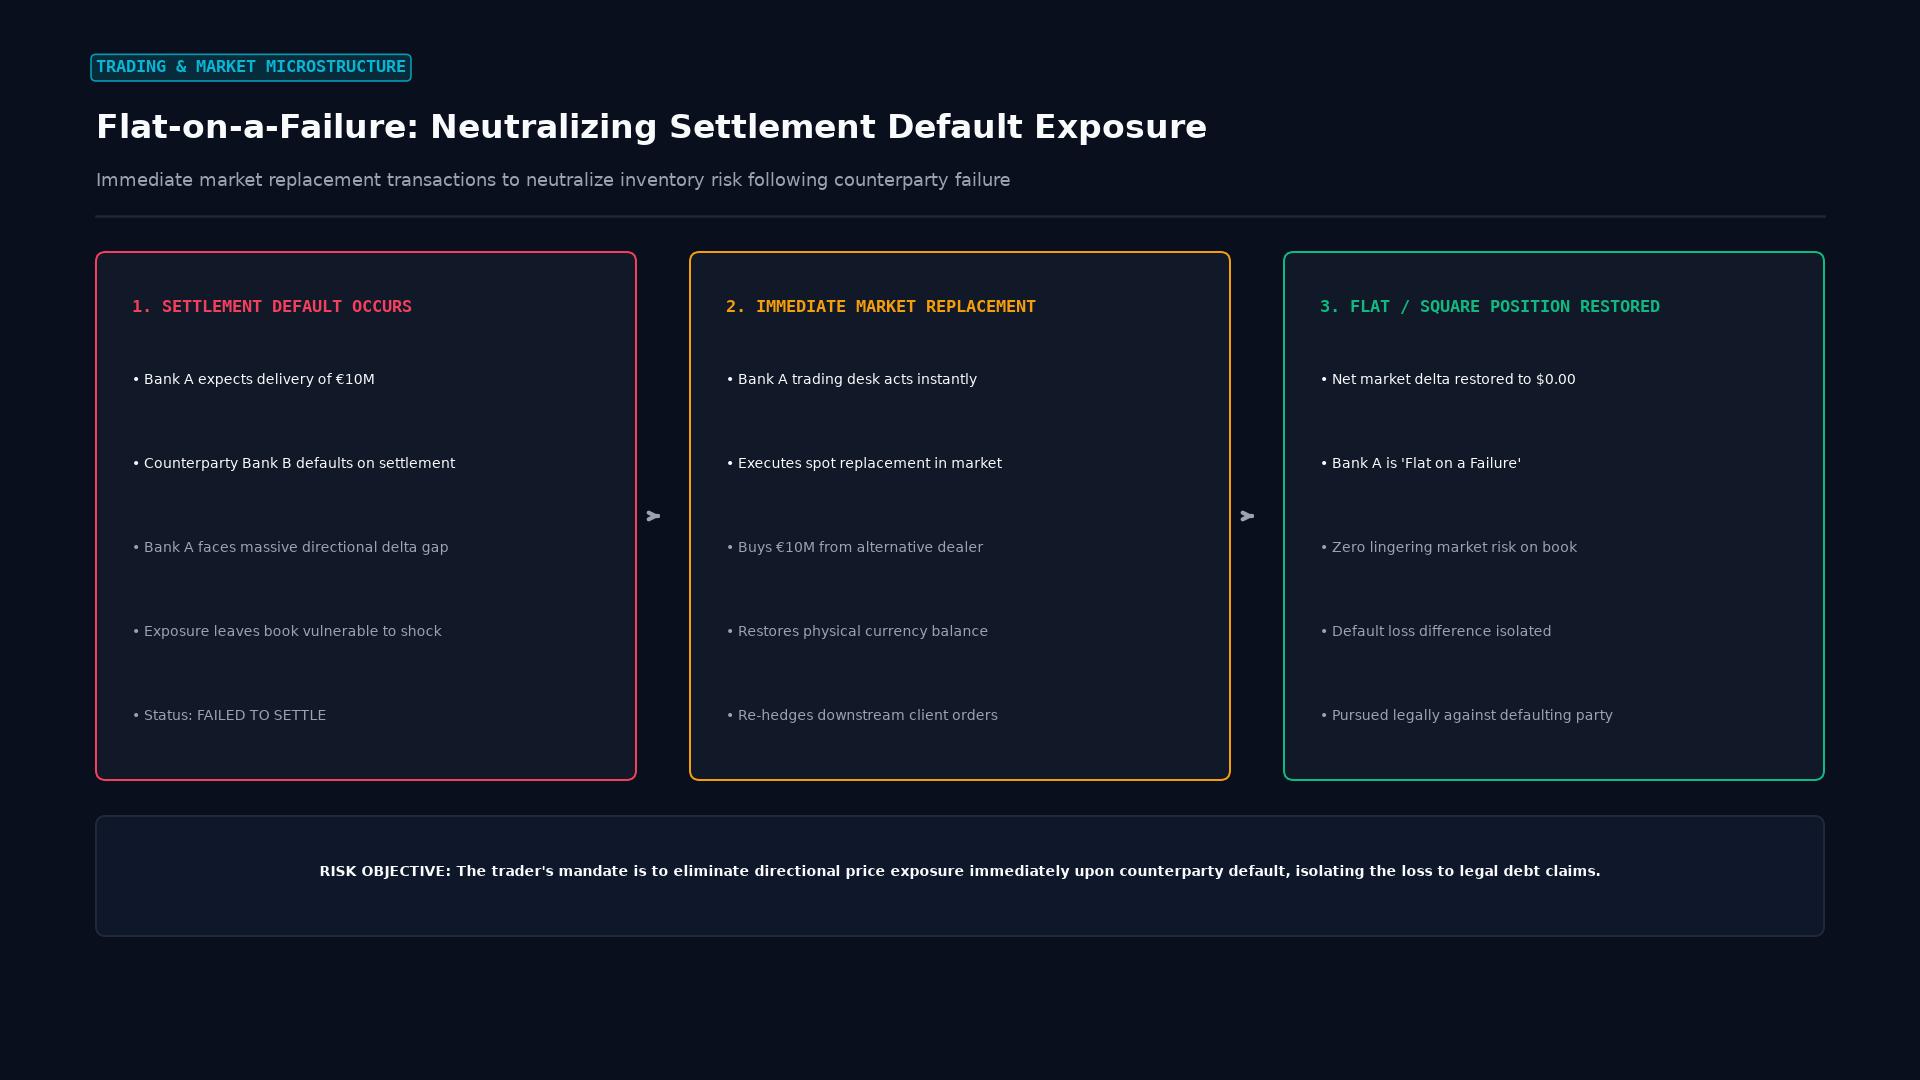 Figure: Post-default risk neutralization: executing immediate spot replacement transactions in the open market to restore a flat book after counterparty settlement failure.
Key Takeaways
- Preservation Over Hope: The rule removes emotional hope from the exit process; a failed test of resistance or support is treated as an objective exit signal.
- Locking in Paper Gains: When a long trade approaches a profit target near major resistance, waiting for an absolute breakout can result in round-tripping profits back to break-even if sellers defend the level.
- Recognizing “Bull Traps”: Failed breakouts often trigger sharp counter-trend squeezes as trapped breakout buyers are forced to liquidate; exiting flat on failure insulates the trader from the ensuing trap.
- Re-entry Flexibility: Going flat does not prevent re-entering; if price consolidates cleanly and subsequently executes a decisive, high-volume breakout, the trader can re-enter with fresh risk parameters.
Technical Signals Indicating a Breakout Failure
Traders identify that a technical test has failed by monitoring candlestick geometry and volume behavior at key structural levels:
| Rejection Pattern | Candlestick / Chart Characteristics | Market Psychology Signaled |
|---|---|---|
| Long-Wick Pin Bar (Shooting Star) | Price spikes above resistance during the candle, but closes back near the candle open with a long upper wick. | Aggressive institutional selling absorbed all buying pressure at higher prices. |
| Bearish Engulfing Candle | A breakout candle is immediately followed by a large opposing candle that completely engulfs its range. | Immediate shift from buyer dominance to aggressive institutional supply. |
| Volume Exhaustion Divergence | Price pushes to a marginally higher high, but trading volume and momentum oscillators (RSI, MACD) drop sharply. | Buying momentum is completely exhausted; lack of institutional follow-through. |
| Multi-Bar Stagnation | Price touches resistance and prints multiple small-bodied indecision candles (Dojis) without progress. | Buyers lack the conviction to push price across the barrier. |
Holding Through Retracements vs. Going Flat on a Failure
| Dimension | The “Hope” Approach (Holding Through Failure) | The “Flat on a Failure” Rule |
|---|---|---|
| Action Taken | Holds position open, hoping buyers will try again | Closes position immediately at market |
| Worst-Case Scenario | Reversal sweeps stop-loss; large gain turns into loss | Minor regret if price immediately surges without you |
| Emotional State | High anxiety; watching unrealized profits evaporate | Calm and disciplined; trade executed according to rules |
| Capital Utilization | Margin remains tied up in an uncertain, decaying trade | Capital is 100% liquid and available for better setups |
| Long-Term Expectancy | Inconsistent; prone to massive profit drawdowns | High expectancy; protects portfolio equity curve |
Step-by-Step Implementation Framework
- Pre-Trade Identification: Mark critical institutional price barriers (e.g., Daily 200-period SMA, prior monthly high, round psychological numbers like 1.3000) before entering the trade.
- The Test Phase: When price action arrives within 5 to 10 pips of the barrier, shift to an active monitoring state.
- The Failure Trigger: Look for the current timeframe candle (e.g., 1-Hour or 4-Hour) to close. If the candle tests the level, gets rejected, and closes back below resistance, the failure condition is triggered.
- Execution: Close the entire position (or at least 70% to 80% of the volume) at market. Adjust any remaining runner’s stop-loss tightly below the rejection candle low.
Frequently Asked Questions
What if the market breaks out right after I go flat?
This is a standard psychological hurdle. Professional trading is about following an asymmetrical risk process, not catching every single pip. If the market genuinely breaks out later with high volume and a decisive candle close above resistance, you can simply re-enter the trade on a healthy retest of the broken level.
Does “flat on a failure” apply to short positions as well?
Yes. For a short position, if price plunges into a major historical support floor (or double-bottom zone) and prints a bullish hammer or fails to break downward, the trader immediately goes flat to avoid getting caught in a vicious short-covering rally.
Should I go flat immediately or wait for the current candle to close?
For swing traders, waiting for the candle to officially close on the operational timeframe (e.g., H1 or H4) is essential to filter out intraday noise. Exiting prematurely on intra-candle wicks can lead to being shaken out of valid continuation moves.
Ready to trade forex?
Open a free demo account with a regulated broker. Practice with virtual funds before risking real money.