High/Low
High/low refers to the maximum and minimum market execution prices recorded for a currency pair or financial asset across a specified timeframe, establishing the trading range and defining volatility boundaries for technical analysis.
What Is High/Low?
In financial charting, technical analysis, and market microstructure, the high/low denotes the absolute peak (high) and trough (low) transaction prices reached by an asset during a specific trading session, period, or bar interval. Whether viewed on a 5-minute intraday candle, a 24-hour daily chart, or a multi-year secular cycle, the high and low establish the boundaries of price discovery, quantifying market sentiment, price range, and volatility.
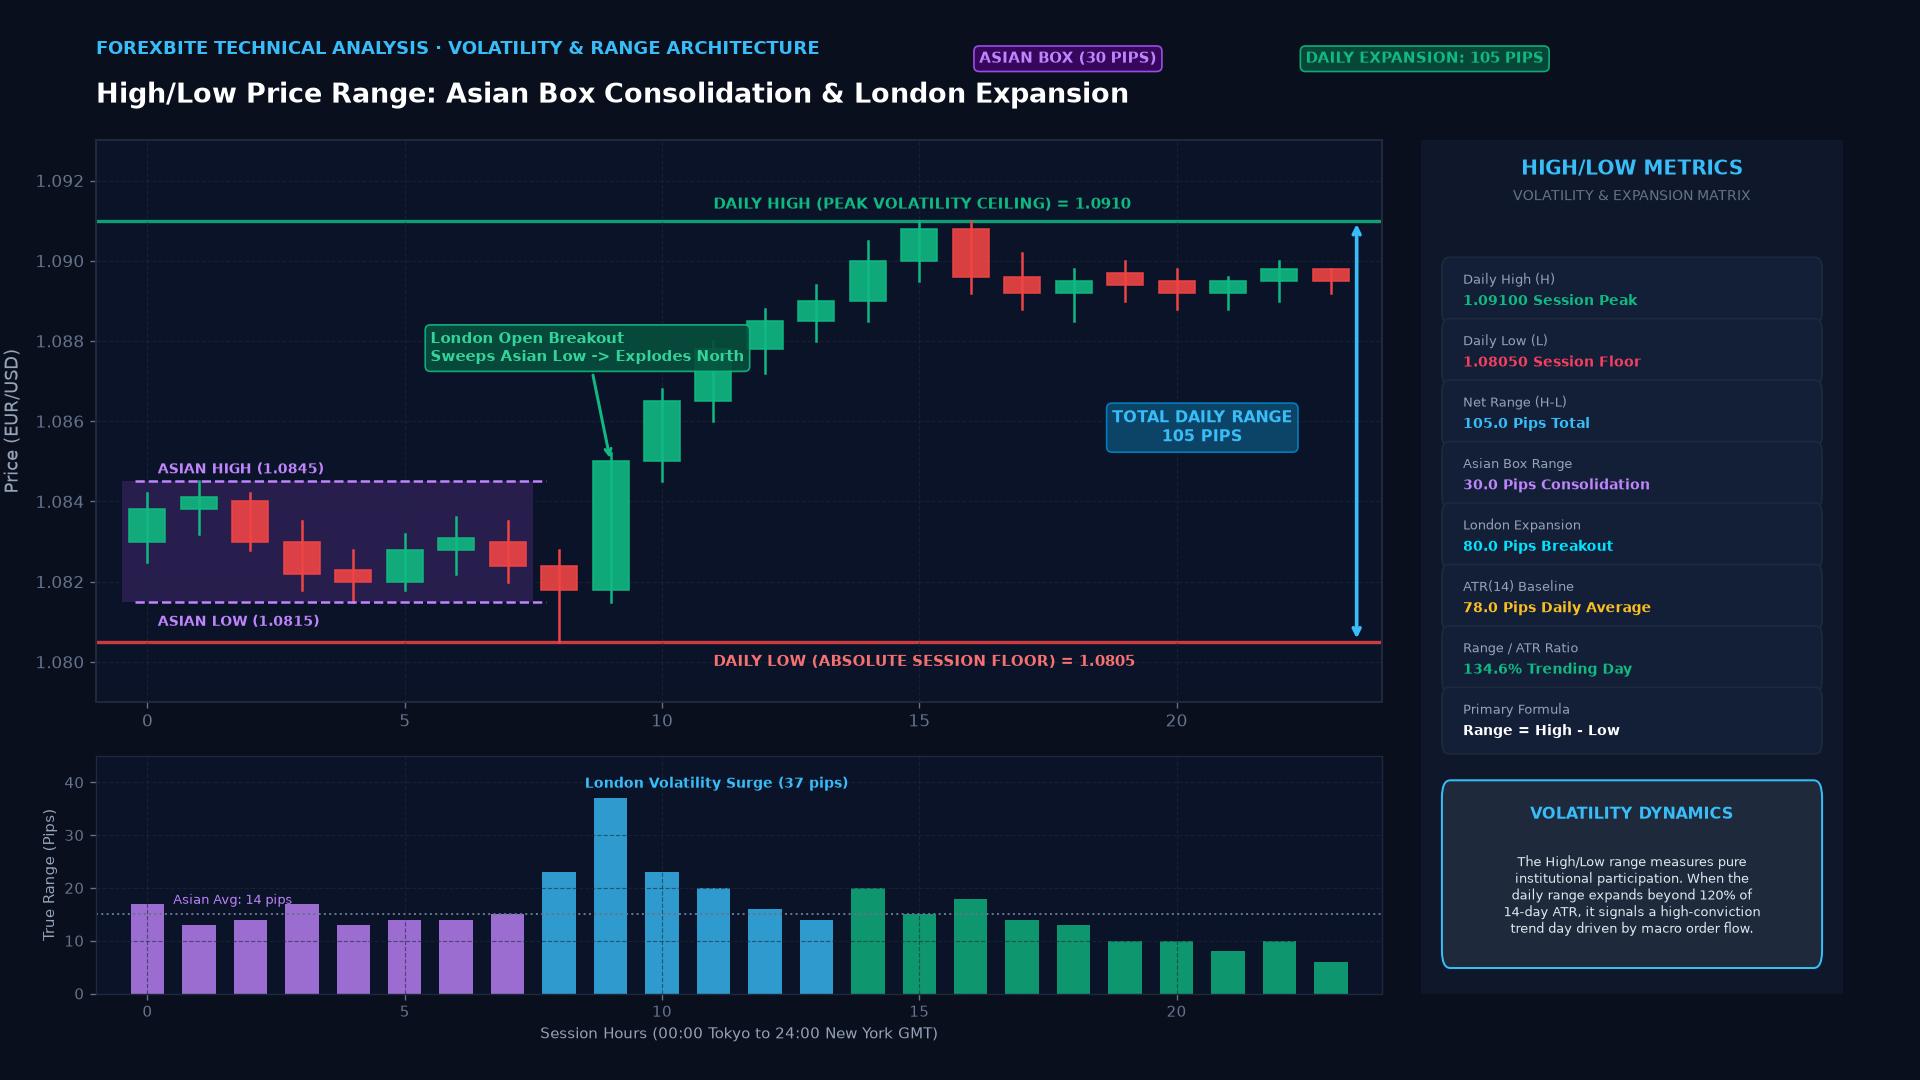
In the 24-hour global foreign exchange (FX) market, the daily high and low are monitored with intense scrutiny by institutional order matching algorithms, proprietary trading desks, and retail chartists. Critical session highs and lows—such as the Asian Session High/Low, the Previous Day High/Low (PDH/PDL), and the 52-Week High/Low—serve as powerful magnets for market liquidity, acting as primary hubs for stop-loss orders and breakout execution.
Key Takeaways
- Range Quantification: The mathematical variance between the high and the low is the trading range ($\text{Range} = \text{High} - \text{Low}$), serving as the foundational variable for the Average True Range (ATR).
- Liquidity Clustering: Stop-loss orders and breakout buy/sell stops cluster densely just above previous session highs and below previous session lows.
- Session Highs and Lows: In currency trading, the high and low established during the Tokyo (Asian) session frequently set the initial boundaries tested during the volatile London and New York overlaps.
- Support and Resistance Transformation: A broken historical high typically flips to become a strong future technical support floor (“resistance becomes support”), and vice versa.
The Strategic Importance of Key High/Low Levels
1. Previous Day High (PDH) and Previous Day Low (PDL)
Day traders and algorithmic liquidity sweep models use the previous day’s extreme boundaries as key operational pivot levels:
- Liquidity Sweeps (Fakeouts): Smart money algorithms frequently push price 5 to 15 pips above yesterday’s high to trigger retail buy-stop orders and absorb liquidity, before violently reversing price in the opposite direction.
- Trend Continuation: A decisive, high-volume candle close above the PDH confirms strong institutional buying pressure, often initiating a multi-day momentum trend.
2. Asian Session High and Low (The London Breakout Setup)
Because the Tokyo session exhibits lower volume and tighter trading ranges compared to Western sessions, the Asian High and Low form a well-defined consolidation box. When the European and London markets open at 08:00 AM London time, institutional order flow frequently breaks out aggressively beyond the Asian high or low.
3. The 52-Week High/Low (Macro Indicator)
Monitored by sovereign wealth funds and global macro asset managers. When a major currency pair breaches its 52-week high, it signals a structural shift in interest rate differentials or terms of trade, drawing long-term institutional trend-following capital into the market.
High/Low in Mathematical Volatility Indicators
The relationship between highs and lows is central to classic quantitative technical indicators:
| Technical Indicator | Formula / Core Role of High/Low | Trading Utility |
|---|---|---|
| True Range (TR) | $\max[(\text{High} - \text{Low}), | \text{High} - \text{Prior Close} |
| Average True Range (ATR) | 14-period exponential smoothing of True Range | Dynamically calibrates stop-loss buffers and position sizing based on live volatility. |
| Stochastic Oscillator | $%K = \left(\frac{\text{Close} - \text{Low}_n}{\text{High}_n - \text{Low}_n}\right) \times 100$ | Measures where current price closed relative to the $n$-period high/low range to spot exhaustion. |
| Donchian Channels | Upper Band: Highest High ($n$); Lower Band: Lowest Low ($n$) | Basis for the classic Turtle Trading breakout trend-following system. |
High/Low Price Rejection vs. Decisive Acceptance
Rejection (Liquidity Trap) vs. Acceptance (Breakout):
       PRICE REJECTION (SWEEP)                       PRICE ACCEPTANCE (TREND)
   Price ($)                                     Price ($)
     ▲              HIGH                           ▲
     │             ╭──╮◄── LONG WICK               │              ╭───────
     │─────────────│──│────────────────            │──────────────│─────── HIGH
     │             │  │   Candle closes            │         ╭────╯ Strong body
     │             │  │   BELOW High               │         │      closes ABOVE
──┴─────────────┴──┴────────────────► ──┴─────────┴────────────►- Price Rejection: Price pokes above the high but prints a long upper wick and closes back inside the range. Indicates lack of buyer follow-through and often precedes a sharp mean-reverting selloff.
- Price Acceptance: A full, solid candle body closes clearly above the high, accompanied by expanding tick volume, confirming that institutional market participants accept higher valuations.
Frequently Asked Questions
Which high/low should I use for a 24-hour daily forex candle?
In foreign exchange trading, the industry standard is to use New York 5:00 PM EST Close daily charts. Charts using midnight GMT or local server closes introduce distorted “Sunday candles” that artificially skew daily high and low calculations.
How do market makers use yesterday’s high and low?
Market makers and high-frequency algorithms know that retail traders place stop-losses just beyond yesterday’s high and low. Market makers will often engineer short-term price spikes to trigger these clustered stops, providing the liquidity needed to fill large institutional orders before letting the market reverse.
What is a “Higher High” (HH) and “Higher Low” (HL)?
In classical Dow Theory, an uptrend is formally defined as a sequence of consecutive Higher Highs and Higher Lows. A downtrend is defined as a series of Lower Lows and Lower Highs. A break in this structure signals potential trend reversal.
Ready to trade forex?
Open a free demo account with a regulated broker. Practice with virtual funds before risking real money.