Investment Management
Investment management is the professional handling of securities and financial assets to meet specified investment goals for institutional and individual clients, encompassing portfolio construction, asset allocation, performance attribution, and fiduciary compliance.
What Is Investment Management?
Investment management represents the disciplined, systematic allocation of capital across financial assets to meet defined wealth accumulation, risk mitigation, or liability matching goals. Also referred to as asset management or portfolio management, this discipline bridges economic theory, quantitative modeling, security analysis, and legal fiduciary governance.
Professional managers direct trillions of dollars in global capital. Their client roster spans individual retail savers, ultra-high-net-worth families, corporate pension funds, sovereign wealth entities, and college endowments. The manager’s mandate is not mere stock selection or speculative trading. Rather, it centers on constructing resilient balance sheets, balancing expected market returns against drawdown tolerances, and maintaining strict adherence to regulatory standards such as the Investment Advisers Act of 1940 in the United States and the UCITS directives in the European Union.
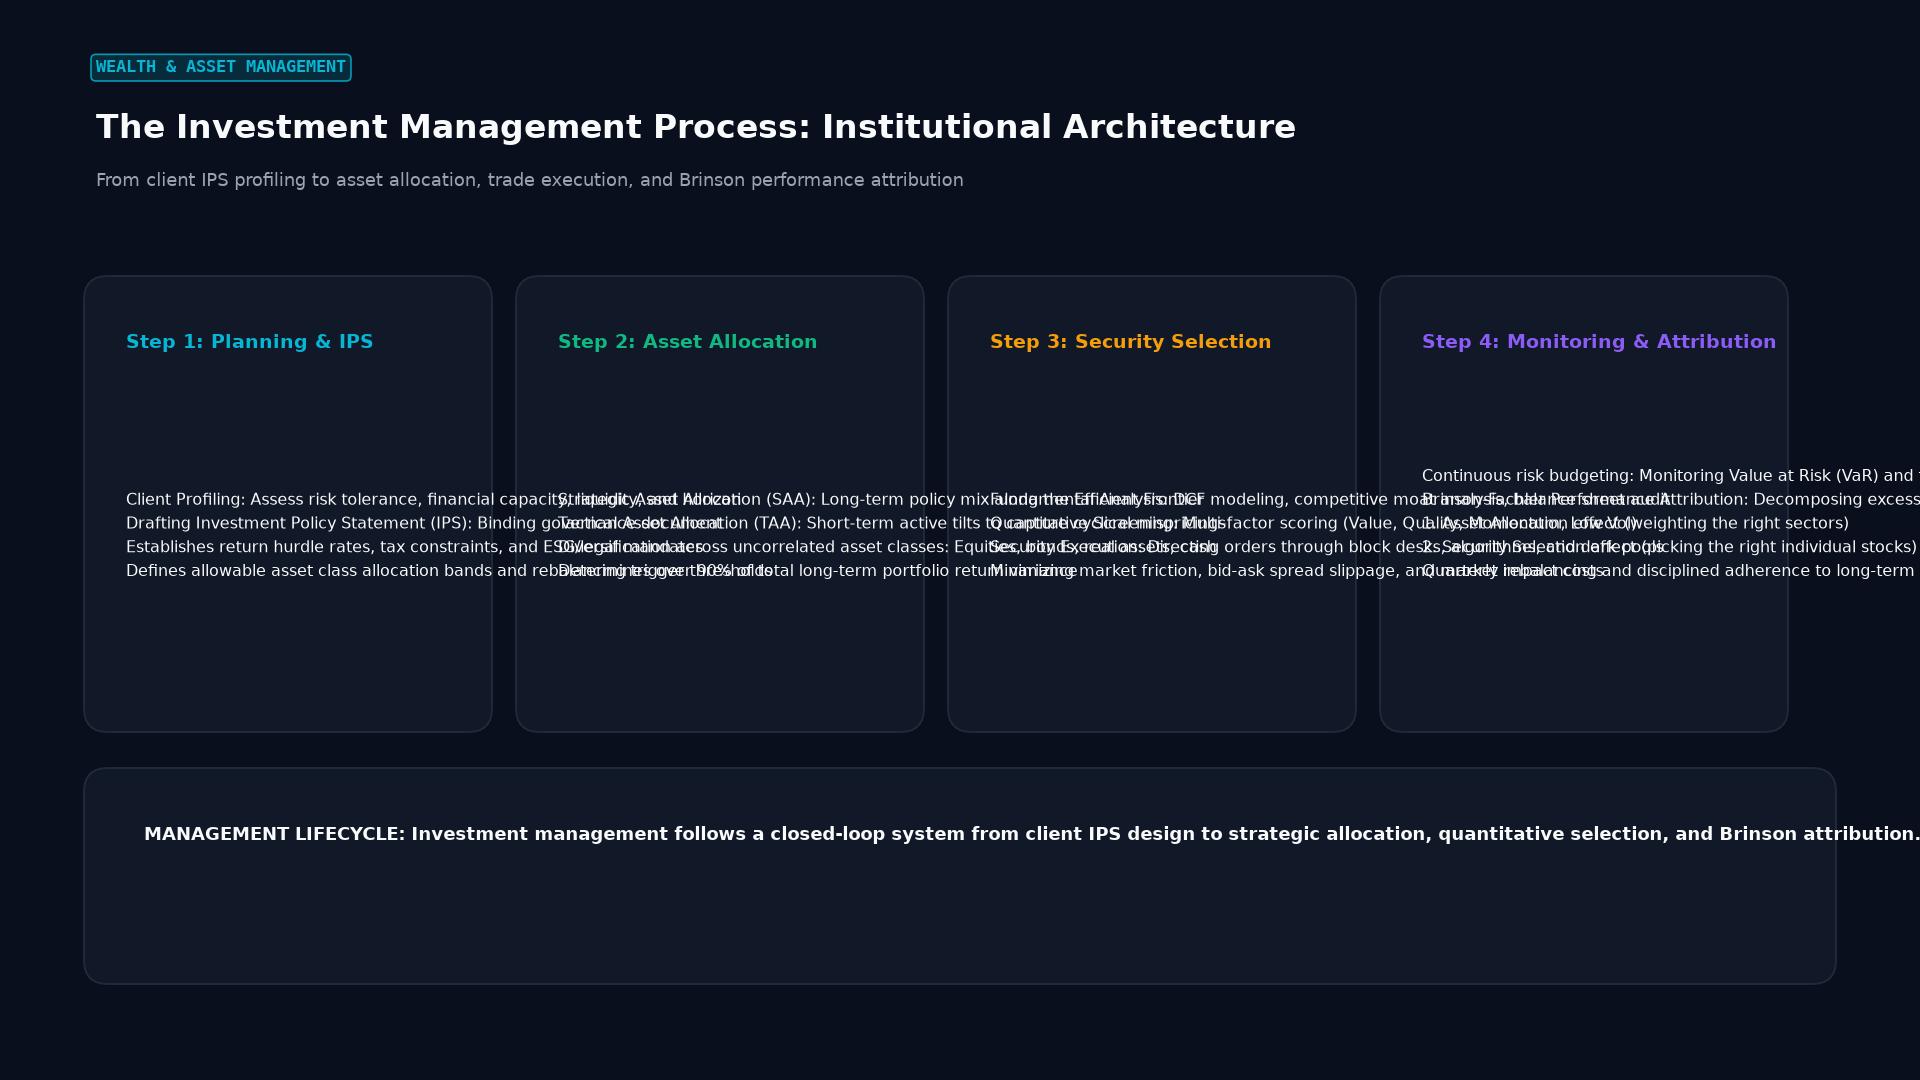 Figure: From client IPS profiling to asset allocation, trade execution, and Brinson performance attribution
Portfolio Architecture: SAA vs TAA
Every institutional investment management workflow rests on an asset allocation policy. Academic research confirms that long-term asset allocation choices account for roughly 90% of the variability in portfolio returns over time, easily overshadowing tactical market timing or individual security picking.
Strategic Asset Allocation (SAA)
Strategic asset allocation forms the base portfolio framework. Established within an Investment Policy Statement (IPS), the SAA sets target weightings for major asset classes: public equities, government and corporate fixed income, real estate, private debt, and cash equivalents. These target weights reflect the investor’s baseline risk capacity and return hurdle over a multi-decade horizon.
Periodically, market movements cause actual portfolio weights to drift from target allocations. When equities experience an extended bull market, equity weightings climb above targets, introducing excess volatility. Institutional managers enforce rigorous rebalancing rules, either calendar-based (such as quarterly or semi-annually) or threshold-based (such as whenever an asset class drifts by 5% or more from its baseline). Rebalancing enforces mechanical discipline: selling appreciated assets and buying lagging assets.
Tactical Asset Allocation (TAA)
Tactical asset allocation permits moderate, short-to-medium-term deviations from the strategic baseline to capture cyclical market mispricings or manage transient macroeconomic hazards. For example, if a management team anticipates tightening monetary conditions and slowing corporate earnings, they might tactically reduce equity exposure from an SAA baseline of 60% down to 52%, reallocating the 8% difference into short-duration Treasury bills. Once macroeconomic conditions stabilize, the portfolio returns to its baseline SAA.
Institutional Investment Vehicles
Professional investment managers deploy investor capital through distinct legal and operational vehicles, each tailored to specific regulatory oversight, liquidity requirements, and investor qualification standards.
| Vehicle Type | Primary Investor Base | Liquidity Structure | Typical Fee Model | Regulatory Framework |
|---|---|---|---|---|
| Mutual Funds (Open-End) | Retail and retirement accounts | Daily redemption at net asset value (NAV) | Flat management fee (0.25% to 1.50% AUM) | SEC Investment Company Act of 1940 / UCITS |
| Exchange-Traded Funds (ETFs) | Retail, institutional, high-frequency traders | Continuous intraday secondary exchange trading | Low expense ratios (0.03% to 0.75% AUM) | SEC Rule 6c-11 / UCITS |
| Separately Managed Accounts (SMAs) | High-net-worth individuals and family offices | Direct legal ownership of individual securities | Tiered AUM scale (0.50% to 1.25% AUM) | Investment Advisers Act of 1940 |
| Hedge Funds (Private Funds) | Qualified institutional buyers, accredited investors | Periodic (quarterly or annual gates with lockups) | Management fee plus performance carry (2 & 20) | Regulation D, Section 3(c)(1) or 3(c)(7) exemptions |
| Private Equity & Venture Capital | Sovereign wealth, pension funds, endowments | Illiquid (7 to 12 year capital commitment periods) | Capital commitment fee plus 20% carry above hurdle | SEC private fund adviser rules / AIFMD |
Fee Structures and Alignment of Interests
The economics of investment management hinge on the fee schedule agreed upon between client and manager. Fee models determine operational sustainability and directly incentivize managerial risk behavior.
Assets Under Management (AUM) Fees
The dominant model across traditional retail and institutional wealth management is a flat or tiered percentage of total assets under management. A standard institutional scale might charge 0.65% on the first $10 million, 0.50% on the next $40 million, and 0.35% on balances exceeding $50 million. While this model eliminates churn incentives inherent to broker commissions, it exposes clients to fee drag during extended market downturns, as managers collect compensation regardless of whether absolute account values rise or fall.
Incentive Fees and High-Water Marks
Alternative managers typically employ a performance-based fee structure, historically recognized as the “2 and 20” model: a 2% base management fee combined with a 20% share of generated net profits. To protect institutional capital, sophisticated allocators demand protective contractual covenants:
- Hurdle Rate: The manager earns performance carry only after portfolio returns surpass a predetermined hurdle rate, such as the yield on the 90-day Treasury bill or a fixed benchmark like 6% per annum.
- High-Water Mark (HWM): A contractual stipulation preventing managers from receiving performance fees on returns that merely recoup past losses. If a $100 million fund declines to $80 million, the manager receives zero performance allocation on subsequent gains until the fund net asset value eclipses the prior peak of $100 million.
Fiduciary Duties vs Suitability Standards
Investment management operates under rigorous legal duties that separate true investment advisers from transactional broker-dealers.
Under the United States Investment Advisers Act of 1940, registered investment advisers (RIAs) are bound by an affirmative fiduciary duty. This duty comprises two distinct legal obligations: the duty of care and the duty of loyalty. The duty of care requires advisers to provide competent advice, exercise thorough due diligence, and seek best execution on client trades. The duty of loyalty compels advisers to put client financial interests ahead of their own, eliminate conflicts of interest, or fully disclose any unavoidable conflicts.
In contrast, traditional retail broker-dealers historically operated under the lesser “suitability” standard, which merely mandated that an investment recommendation was broadly suitable for a client’s age and income, even if it paid the broker a higher hidden commission than an identical lower-cost alternative. While the SEC’s Regulation Best Interest (Reg BI) has narrowed this gulf, the pure fiduciary mandate remains the defining hallmark of professional institutional asset management.
Performance Attribution and Risk Analytics
Evaluating an investment manager requires disentangling true operational skill from broad market beta. Institutional allocators rely on quantitative metrics to judge value delivery.
The Brinson-Hood-Beebower Attribution Model
Institutional allocators divide excess performance into three distinct drivers:
- Allocation Effect: Returns generated by overweighting outperforming asset sectors and underweighting underperforming sectors relative to the benchmark.
- Selection Effect: Returns generated by picking outperforming individual securities within each respective sector.
- Interaction Effect: The residual return stemming from the simultaneous interplay of allocation and security selection decisions.
Risk-Adjusted Return Metrics
Gross nominal return figures offer little insight without measuring the risk assumed to achieve them. Institutional oversight teams evaluate managers using standardized risk formulas:
               R_p - R_f
Sharpe Ratio = ---------
                 sigma_p

                  R_p - R_b
Information Ratio = ---------
                    sigma_e
Where $R_p$ is portfolio return, $R_f$ is the risk-free rate, $\sigma_p$ is portfolio standard deviation, $R_b$ is benchmark return, and $\sigma_e$ is tracking error volatility. A manager displaying a 15% annual return with a high tracking error and a sub-0.5 Information Ratio may simply be taking uncompensated factor bets rather than generating reliable, risk-controlled alpha.
Key Takeaways
- Investment management is the institutional discipline of structuring, deploying, and governing capital across asset classes to meet client-specific financial objectives under statutory fiduciary standards.
- Strategic Asset Allocation (SAA) establishes the multi-year baseline asset split that drives roughly 90% of long-term return variability, while Tactical Asset Allocation (TAA) seeks shorter-term cyclical gains.
- Institutional fee arrangements range from tiered AUM percentages to performance carry protected by hurdle rates and high-water marks.
- Registered investment advisers bear an affirmative fiduciary duty of care and loyalty, requiring them to prioritize client interests over personal or firm profits.
- Rigorous performance attribution separates passive market exposure (beta) from repeatable managerial skill (alpha) through quantitative tools like the Brinson model and Information Ratio.
Frequently Asked Questions
What is the difference between wealth management and investment management?
Investment management focuses primarily on portfolio construction, asset allocation, security selection, and risk attribution. Wealth management encompasses investment management while providing a broader suite of personal financial services, including estate planning, tax optimization, philanthropic structuring, and life insurance advisory.
What is an Investment Policy Statement (IPS)?
An Investment Policy Statement is a binding operational roadmap drafted jointly by the investment manager and the client. It formally outlines return targets, risk parameters, liquidity requirements, tax constraints, permitted and prohibited asset classes, benchmark indexes, and scheduled rebalancing procedures.
How do active and passive investment management strategies differ?
Active management employs research teams, quantitative algorithms, and macro analysis to buy undervalued assets and short overvalued ones, aiming to outperform a stated market benchmark. Passive management seeks to match the exact returns of an index (such as the S&P 500 or Bloomberg Aggregate Bond Index) at minimal cost by holding the identical basket of underlying securities.
Ready to trade forex?
Open a free demo account with a regulated broker. Practice with virtual funds before risking real money.