M1
M1 is a foundational measure of the narrow money supply that tracks the most liquid transactional assets within an economy, comprising physical currency in circulation, demand deposits, and other liquid checkable deposits.
What Is M1?
M1 is an essential macroeconomic indicator representing the narrowest formal measure of the money supply in modern economic accounting. Tracked and published weekly by major central banks (most notably the United States Federal Reserve via the H.6 Statistical Release (Money Stock Measures)), M1 captures the total volume of financial assets that are immediately spendable as a medium of exchange without incurring liquidation delays or conversion penalties.
Unlike broader monetary aggregates that incorporate illiquid term investments and institutional funding lines, M1 focuses strictly on transactional liquidity. It measures the cash in consumers’ physical wallets, the checking account balances tapped via debit cards, and commercial demand deposits used by businesses to clear daily payroll and supplier invoices. In monetary economics, shifts in the growth rate of M1 provide direct insight into household liquidity preferences, consumer spending velocity, and commercial banking credit expansion.
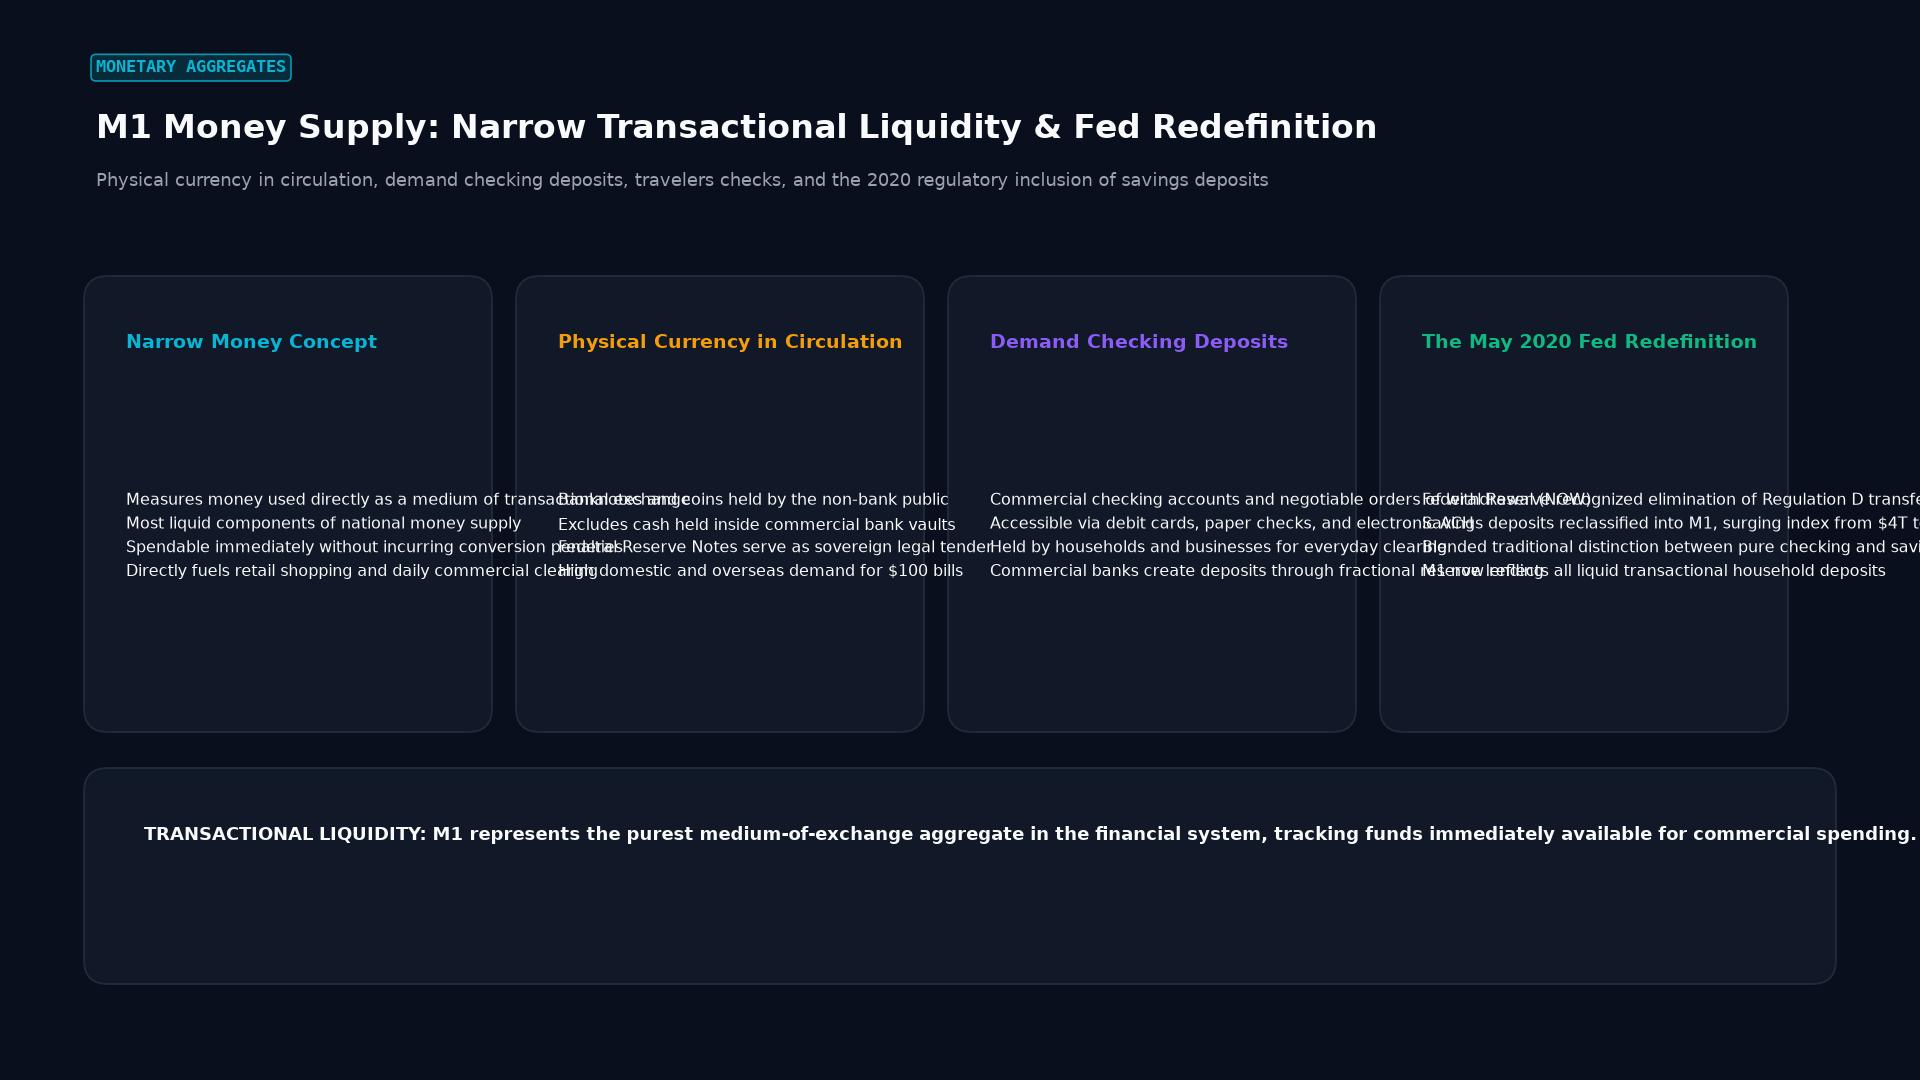 Figure: Physical currency in circulation, demand checking deposits, travelers checks, and the 2020 regulatory inclusion of savings deposits
The Mathematical Components of M1
In standard central banking taxonomy, the formulation of M1 aggregates specific categories of transactional liquidity:
M1 = Currency in Public Circulation + Demand Deposits + Other Liquid Deposits1. Currency in Public Circulation
This includes all physical paper currency (Federal Reserve notes) and metallic coins held by the non-bank public. It explicitly excludes cash held inside commercial bank vaults and central bank cash reserves, as those funds are not actively circulating in the consumer economy.
2. Demand Deposits
Non-interest-bearing checking accounts held at commercial banks that are legally payable immediately on demand via check, debit card swipe, or electronic Automated Clearing House (ACH) transfer.
3. Other Liquid Deposits
Interest-bearing checkable deposits, including Negotiable Order of Withdrawal (NOW) accounts at depository institutions, credit union share draft accounts, and automated transfer service (ATS) balances.
4. Traveler’s Checks
Historically, non-bank traveler’s checks were tracked as an independent sub-component of M1. Due to the universal adoption of credit and debit cards, physical traveler’s checks have declined to negligible volumes and were phased out of active standalone statistical reporting by several major central banks.
The Historic May 2020 Federal Reserve Regulatory Change
Anyone analyzing historical M1 charts will observe an astonishing statistical anomaly: in the spring of 2020, reported United States M1 surged overnight from roughly $4 trillion in February 2020 to over $16 trillion in May 2020, eventually climbing past $20 trillion.
M1 MONEY SUPPLY (USD Trillions)
   22 |                                         * * * * *
   20 |                                     * *
   18 |                                 * *
   16 |                               *  <--- May 2020 Reg D Revision
   14 |                              *        (Savings reclassified into M1)
   12 |                             *
   10 |                            *
    8 |                           *
    6 |                          *
    4 | * * * * * * * * * * * * *
    2 |
    0 +--------------------------------------------------> TIME
        2016    2017    2018    2019    2020    2021    2022
While financial headlines frequently attributed this vertical surge entirely to aggressive post-pandemic quantitative easing and physical money printing, the primary driver was a fundamental accounting reclassification triggered by Federal Reserve Regulation D:
- Pre-2020 Regulation D Constraint: Historically, federal regulations imposed a strict limit of six convenience withdrawals or transfers per month on standard consumer savings accounts. Because of this legal friction, savings accounts were classified as “near-money” and included exclusively in M2, while checking accounts remained in M1.
- The April 2020 Rule Elimination: In response to pandemic liquidity needs, the Federal Reserve Board of Governors eliminated the six-transfer withdrawal limit, allowing bank customers to make unlimited transfers from their savings accounts.
- The May 2020 Statistical Realignment: Because savings deposits were now legally as spendable and liquid as traditional checking accounts, the Federal Reserve updated its H.6 statistical definitions, reclassifying savings deposits (including money market deposit accounts) directly into M1.
This administrative revision instantly transferred trillions of dollars from M2’s non-M1 category directly into M1, creating a structural break in the time series data that analysts must account for when modeling historical correlations.
Economic Velocity and the Equation of Exchange
In classical monetary economics, M1 is linked to real economic activity through the Irving Fisher Equation of Exchange:
M1 * V_1 = P * YWhere:
- $M1$ is the nominal narrow money supply
- $V_1$ is the velocity of M1 (the number of times an average dollar is spent on finished goods and services per year)
- $P$ is the general price level
- $Y$ is real economic output (Real GDP)
- $P \times Y$ equals Nominal GDP
When central banks expand the money supply rapidly, the macroeconomic outcome depends on money velocity ($V_1$):
- If velocity remains constant, expanding M1 drives up nominal output or fuels consumer price inflation ($P$).
- If consumer and corporate confidence collapses, individuals hoard cash in checking accounts. Velocity plunges, offsetting the surge in money supply and blunting the inflationary impact. Following the 2008 and 2020 crises, dramatic declines in M1 velocity prevented massive quantitative easing from immediately producing runaway hyperinflation.
Fractional-Reserve Banking and the Money Multiplier
M1 is not created solely by the central bank printing physical notes. In a fractional-reserve banking system, the private banking sector creates the vast majority of M1 through commercial loan creation.
When a commercial bank issues a $500,000 corporate loan or residential mortgage, it does not disburse physical stacks of banknotes from its vault. Instead, it creates a new $500,000 demand deposit in the borrower’s checking account with an accounting keystroke.
The theoretical ceiling of this credit expansion is governed by the money multiplier formula:
                  1 + c
Multiplier (m) = -------
                 r + e + c
Where $r$ represents the statutory reserve requirement ratio set by the central bank, $e$ is the excess reserve ratio held voluntarily by commercial banks, and $c$ is the public’s currency-to-deposit ratio. When banks aggressively expand lending, credit creation inflates demand deposits, rapidly expanding the M1 money stock.
Key Takeaways
- M1 measures the narrow money supply, capturing the most liquid transactional assets in an economy, including physical cash and demand checking deposits.
- The indicator is published regularly by central banks (such as the Federal Reserve’s H.6 release) to evaluate liquidity and economic spending capacity.
- The dramatic spike in US M1 in May 2020 was primarily an accounting reclassification resulting from the Fed’s removal of Regulation D transfer limits on savings accounts.
- The macroeconomic impact of M1 growth is governed by the Equation of Exchange ($M1 \times V_1 = P \times Y$), where changes in money velocity determine whether liquidity triggers inflation.
- Private commercial banks generate the vast majority of M1 through fractional-reserve credit creation and deposit origination.
Frequently Asked Questions
What is the difference between M0 and M1?
M0 (the monetary base) consists solely of physical currency in circulation plus commercial bank reserve balances held at the central bank. M1 represents narrow money available to the public, adding commercial bank demand checking deposits to physical cash while excluding central bank reserve balances.
Why did the Federal Reserve stop tracking traveler’s checks as a separate component of M1?
Traveler’s checks were phased out of standalone reporting because consumer usage collapsed over the past three decades. The widespread adoption of electronic debit cards, credit networks, and global ATM infrastructure reduced traveler’s checks to an economically insignificant fraction of total liquidity.
Does a sudden increase in M1 always cause consumer price inflation?
No. An increase in M1 causes inflation only if aggregate money velocity remains stable or expands, leading to excess money chasing a finite supply of goods and services. If households and businesses hoard the newly created money in checking accounts, velocity collapses, neutralizing immediate inflationary pressure.
Ready to trade forex?
Open a free demo account with a regulated broker. Practice with virtual funds before risking real money.