M2
M2 is a key broad monetary aggregate that encompasses all of M1 narrow money plus highly liquid near-money assets, including small-denomination time deposits and retail money market mutual funds, functioning as a primary barometer of macroeconomic liquidity and inflation.
What Is M2?
M2 is a key broad measure of the money supply in modern macroeconomic accounting. Tracked closely by central banks, institutional investors, and sovereign credit rating agencies, M2 captures the total stock of money immediately available for consumption plus “near-money” liquid assets that can be converted into transactional cash quickly and without significant capital loss.
While M1 isolates immediate transactional money (physical cash, checking accounts, and liquid demand deposits), M2 broadens the analytical scope to include household savings and short-term retail investment balances. Economists view M2 as the definitive indicator of broad consumer purchasing power and systemic banking liquidity. Sustained shifts in M2 growth rates historically provide reliable early warnings regarding impending inflationary waves, macroeconomic expansions, and commercial credit contractions.
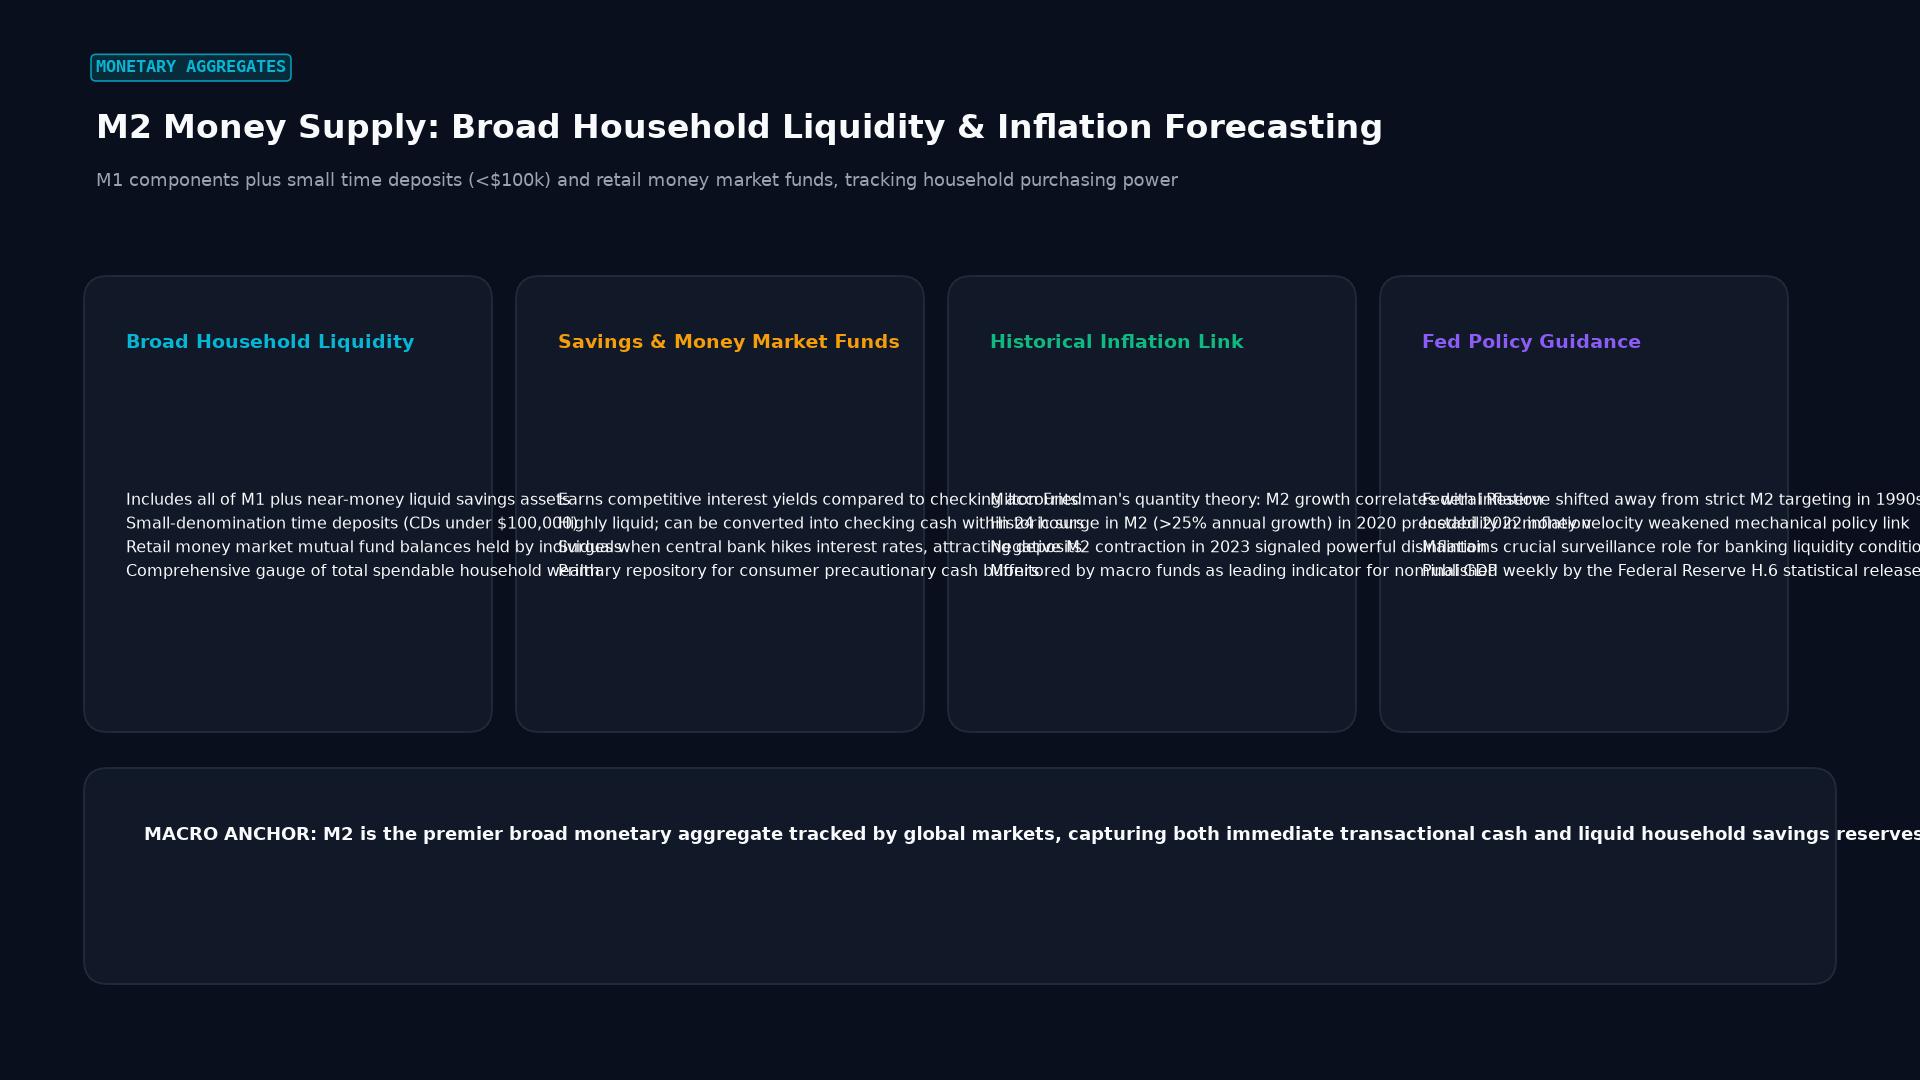 Figure: M1 components plus small time deposits (<$100k) and retail money market funds, tracking household purchasing power
The Mathematical Composition of M2
In the United States, the Federal Reserve compiles and reports M2 data through its weekly H.6 Statistical Release. The formal equation defining M2 is:
M2 = M1 + Small-Denomination Time Deposits + Retail Money Market Funds1. The Core M1 Component
M2 includes 100% of M1. Following the Federal Reserve’s May 2020 regulatory revisions under Regulation D, savings deposits and money market deposit accounts (MMDAs) are classified directly within M1, establishing M1 as the dominant baseline component of M2.
2. Small-Denomination Time Deposits
Fixed-term savings vehicles (predominantly retail Certificates of Deposit, or CDs) with face values of less than $100,000. These accounts impose minor penalties for early withdrawal before scheduled maturity, distinguishing them from pure on-demand checking accounts.
3. Retail Money Market Mutual Funds (MMFs)
Non-institutional money market investment funds held by individual retail investors. These funds invest in ultra-short-term, high-grade debt instruments (such as Treasury bills and commercial paper) while maintaining a stable $1.00 net asset value (NAV). Institutional money market funds are excluded from M2 because they represent wholesale corporate treasury management rather than consumer purchasing power.
The Quantity Theory of Money and the Inflation Link
In classical monetary economics, the analytical importance of M2 is rooted in the Quantity Theory of Money, formalized by the Irving Fisher equation of exchange:
M * V = P * YWhere:
- $M$ represents the broad money supply (M2)
- $V$ is the velocity of money (how many times per year an average unit of currency is spent on final goods and services)
- $P$ is the general price level (the GDP deflator or Consumer Price Index)
- $Y$ is real economic output (Real GDP)
- $P \times Y$ equals Nominal GDP
Nobel laureate Milton Friedman famously declared that “Inflation is always and everywhere a monetary phenomenon in the sense that it is and can be produced only by a more rapid increase in the quantity of money than in output.”
When central banks and fractional-reserve banking systems expand M2 at a rate significantly faster than real output ($Y$) can grow, the excess money supply bids up prices across the economy, generating consumer price inflation ($P$), unless accompanied by an equivalent collapse in money velocity ($V$).
        Nominal GDP (P * Y)
V_2 = ---------------------
               M2
The 2020–2023 Boom, Inflation Spike, and Historic Contraction
The behavior of US M2 between 2020 and 2023 provided an extraordinary real-world test of monetary theory:
1. The 2020–2021 Liquidity Surge
In response to the global pandemic, the US federal government enacted unprecedented fiscal stimulus programs (direct household stimulus checks, Paycheck Protection Program loans, expanded unemployment subsidies), which were directly accommodated by the Federal Reserve’s zero interest rate policy and multi-trillion-dollar quantitative easing purchases of Treasury bonds.
As a result, US M2 expanded by an extraordinary 27% year-over-year in early 2021, marking the fastest rate of peacetime monetary growth recorded in American economic history. Trillions of newly created dollars flooded into household checking accounts, savings accounts, and retail brokerage accounts.
2. The 2021–2022 Inflation Surge
With a predictable lag of roughly 12 to 18 months, this massive monetary expansion collided with global supply chain bottlenecks. Excess consumer purchasing power chased a constrained supply of physical goods, driving headline US Consumer Price Index (CPI) inflation from 1.4% in early 2021 to a four-decade peak of 9.1% in June 2022.
3. The Historic 2022–2023 M2 Contraction
To restore price stability, the Federal Reserve initiated its most aggressive monetary tightening cycle in forty years, hiking the federal funds rate from 0.00% to above 5.25% and executing quantitative tightening (shrinking its balance sheet by allowing maturing bonds to roll off without replacement).
This policy shock produced an unprecedented macroeconomic phenomenon: in 2022 and 2023, US M2 contracted year-over-year for the first time since the Great Depression of the 1930s. Higher yields on Treasury bills prompted depositors to pull money from commercial banks, while commercial bank credit creation stalled. This monetary contraction successfully cooled aggregate demand, driving inflation back toward the Fed’s 2% target.
Strategic Asset Allocation and Forex Implications
Institutional portfolio managers and foreign exchange traders actively monitor M2 growth rates to adjust risk allocations across asset classes:
| M2 Growth Trajectory | Macroeconomic Environment | Asset Class Implications | Currency Valuation Impact |
|---|---|---|---|
| Accelerating M2 Growth (>8% annually) | Ample liquidity; expanding commercial credit; aggressive central bank stimulus | Bullish for equities, commodities, and real estate; yields compress | Bearish for the domestic currency; purchasing power degrades |
| Moderate M2 Growth (3% to 6% annually) | Balanced non-inflationary growth; sustainable credit expansion | Stable corporate earnings; healthy bond performance | Neutral / Steady domestic currency valuation |
| Contracting M2 Growth (<0% annually) | Monetary tightening; credit rationing; falling bank deposits | Bearish for speculative equities; valuation multiples compress | Bullish for the domestic currency as real yields surge |
Key Takeaways
- M2 is a comprehensive measure of the broad money supply, combining transactional M1 with liquid near-money savings accounts, small CDs, and retail money funds.
- Published weekly in the Federal Reserve’s H.6 release, M2 serves as the primary gauge of consumer purchasing power and systemic banking liquidity.
- Under the Quantity Theory of Money ($M \times V = P \times Y$), sustained surges in M2 relative to real output historically precede periods of consumer price inflation.
- Between 2020 and 2021, US M2 expanded by an unprecedented 27%, triggering the 2022 inflation surge, followed by the first negative M2 contraction since the 1930s.
- Rapid M2 expansion fuels asset price inflation and currency depreciation, while M2 contraction tightens financial conditions and strengthens currency valuation.
Frequently Asked Questions
What is the difference between M1 and M2?
M1 includes only transactional money that is immediately spendable without conversion barriers, such as physical cash and checking deposits. M2 includes all of M1 plus “near-money” liquid savings vehicles, including certificates of deposit under $100,000 and retail money market mutual funds.
Why are institutional money market funds excluded from M2?
Institutional money market funds are held by corporate treasuries, pension systems, and sovereign wealth entities for multi-million-dollar cash management operations. Central banks exclude them from M2 to ensure the metric reflects consumer and household liquidity rather than wholesale capital market clearing.
What does negative M2 growth signify for the economy?
Negative M2 growth indicates that the total quantity of money in the economy is actively shrinking. This typically occurs during aggressive central bank rate hikes when commercial bank lending contracts, deposits flow into government Treasury bills, and corporate debt issuance slows, often foreshadowing economic cooling or recessionary pressure.
Ready to trade forex?
Open a free demo account with a regulated broker. Practice with virtual funds before risking real money.