Managed fund
A managed fund is an investment vehicle that pools capital from multiple investors to purchase a diversified portfolio of securities overseen by a professional fund manager and governed by an official prospectus.
A managed fund (encompassing mutual funds, open-ended investment companies, unit trusts, and UCITS funds) is a collective investment scheme that pools capital from retail, high-net-worth, and institutional investors into a single master portfolio. Professional portfolio managers allocate this pooled capital across diversified asset classes (equities, sovereign debt, corporate credit, commodities, and money market instruments) in accordance with the investment objectives, risk boundaries, and benchmark mandates specified in the fund’s regulatory prospectus.
Investors in a managed fund do not hold title to the underlying individual securities. Instead, they purchase units or shares of the collective fund entity, participating proportionally in the fund’s net income, capital gains, and portfolio asset appreciation. Managed funds provide individual investors with immediate structural diversification, institutional economies of scale, professional oversight, and daily liquidity.
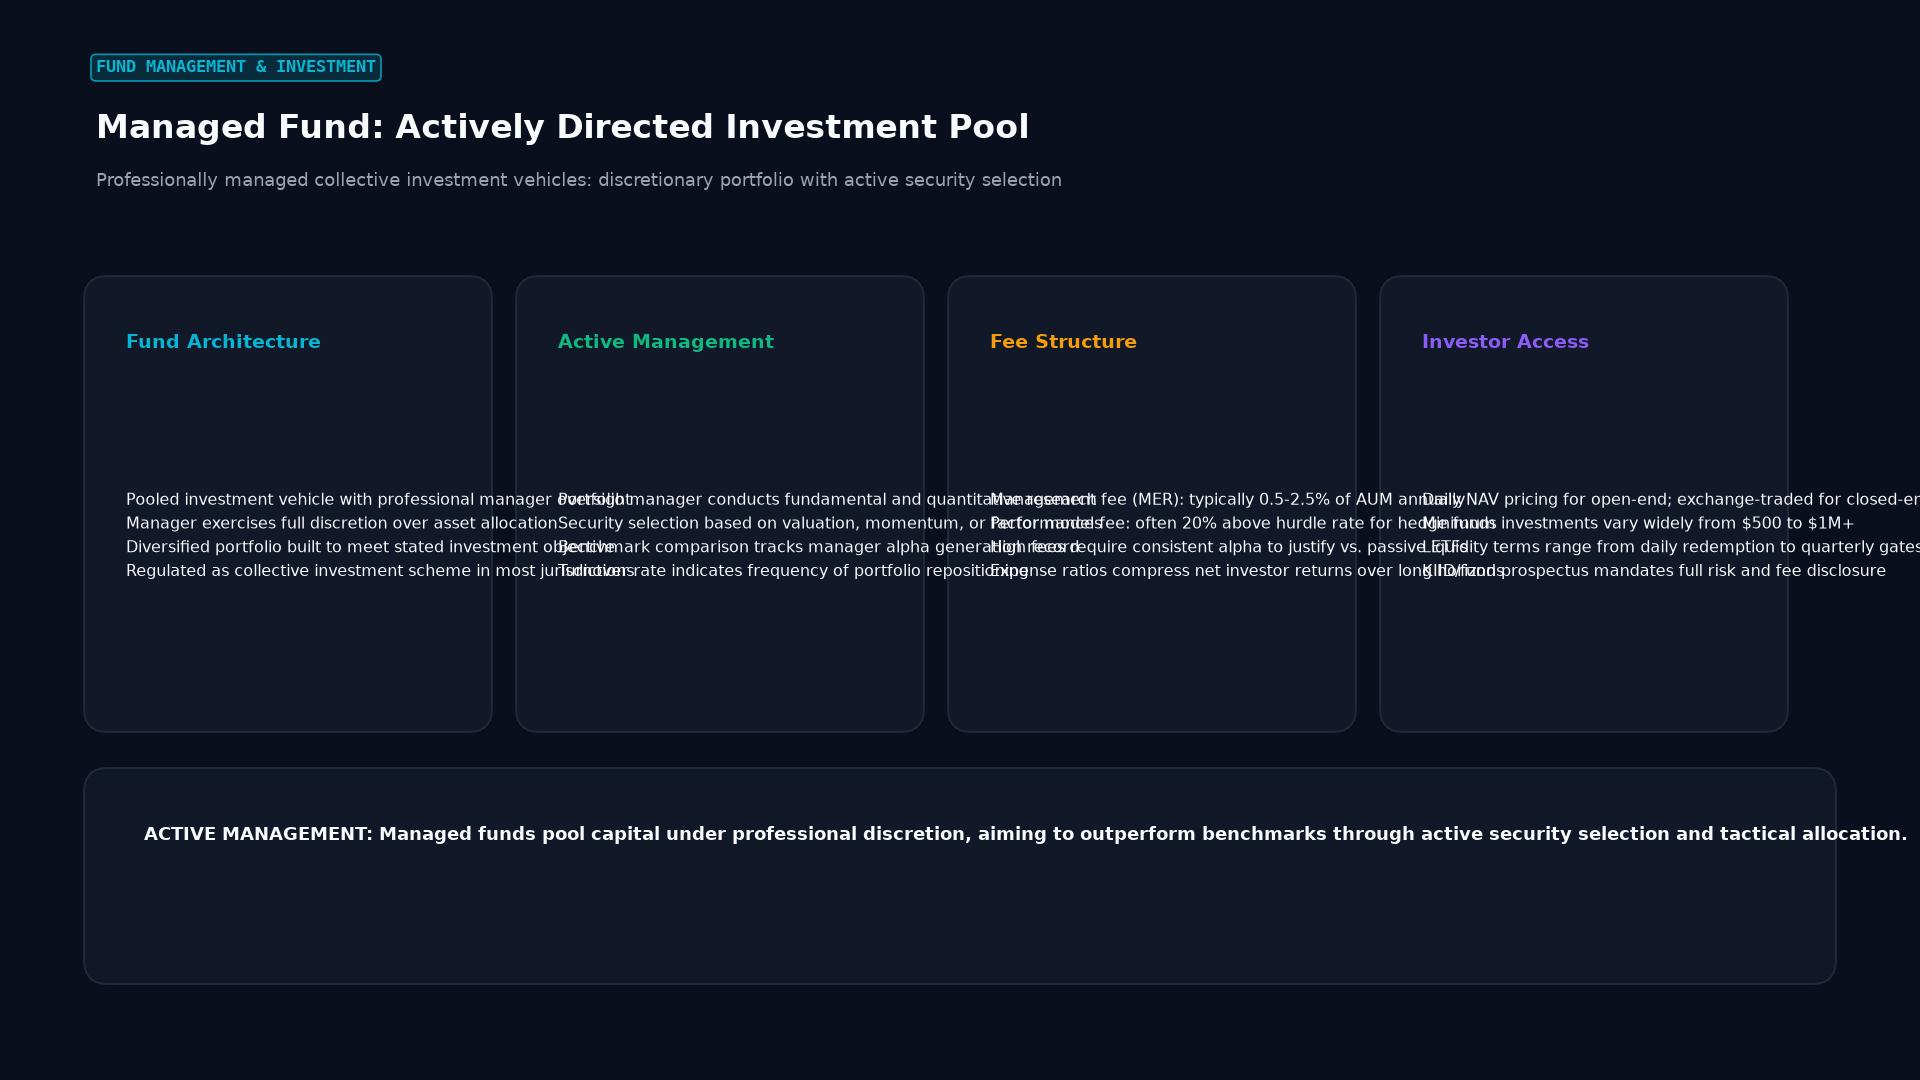 Figure: Professionally managed collective investment vehicles: discretionary portfolio with active security selection
Historical Evolution and Legal Frameworks
The modern managed fund traces its architectural lineage through three centuries of financial innovation and regulatory reform:
1. The Dutch Precursor (1774)
Following the Dutch credit crisis of 1772–1773, merchant Adriaan van Ketwich formed the world’s first documented investment trust, named Eendragt Maakt Magt (“Unity Creates Strength”). Van Ketwich pooled capital from modest Dutch investors to acquire a diversified portfolio of domestic plantation loans and European sovereign debentures, minimizing the systemic default impact of any single issuer.
2. The Massachusetts Investors Trust and Modern Mutual Funds (1924)
On March 21, 1924, the Massachusetts Investors Trust (MIT) launched in Boston, establishing the first modern open-end mutual fund. Unlike closed-end investment trusts of the era, MIT introduced continuous share creation and daily redemption: investors could sell their fund shares directly back to the fund trust at the prevailing net asset value whenever they desired liquidity.
3. The US Investment Company Act of 1940
The stock market crash of 1929 and subsequent congressional investigations revealed widespread abuses among unregulated investment trusts: self-dealing by sponsors, extreme hidden leverage, and opaque accounting.
Congress responded by enacting the Investment Company Act of 1940 (the “1940 Act”), which forms the foundation of modern fund regulation in the United States:
- Mandates that investment companies register formally with the SEC.
- Requires a board of directors with a statutory percentage of independent directors.
- Enforces strict capital structure limitations (Section 18 mandates a minimum 300% asset coverage ratio for any debt issued by an open-end fund, capping leverage).
- Enforces daily net asset value (NAV) calculations and full prospectus disclosure under the Securities Act of 1933.
4. The European UCITS Framework
In Europe, cross-border retail fund distribution is governed by the Undertakings for Collective Investment in Transferable Securities (UCITS) directives, first adopted by the European Council in 1985 (UCITS I) and modernized through UCITS VI. A UCITS-compliant fund registered in one European Union member state (typically Luxembourg or Ireland) can be marketed freely to retail investors across all EU jurisdictions under a single regulatory passport.
       CHRONOLOGICAL MILESTONES: MANAGED FUNDS

Year  Milestone                     Significance
----------------------------------------------------------------------------------
1774  Eendragt Maakt Magt (Holland) First collective pooled investment trust
1924  Massachusetts Investors Trust First open-ended fund with daily redemption
1940  US Investment Company Act     Statutory governance, board independence, leverage caps
1985  European UCITS Directive      Single-passport cross-border European fund distribution
1993  SPDR S&P 500 ETF (SPY) Launch First modern exchange-traded fund structure
Pricing Mechanics: Daily Net Asset Value (NAV)
Open-end managed funds do not trade continuously throughout the trading day at market-clearing bid and ask quotes. Instead, all customer purchase and redemption transactions are settled once per day using Forward Pricing at the fund’s Net Asset Value (NAV).
1. The NAV Calculation Formula
Following the 4:00 PM EST close of major financial exchanges, fund accounting administrators value every security held in the portfolio using the official closing market prices. The Net Asset Value per share is calculated as:
$$\text{NAV} = \frac{\text{Total Market Value of Portfolio Assets} - \text{Total Fund Liabilities}}{\text{Total Number of Fund Shares Outstanding}}$$
Where:
- Total Assets: Fair market value of all equities, bonds, accrued dividends, accrued bond coupon interest, and cash reserves held at the custodian.
- Total Liabilities: Accrued advisory management fees, 12b-1 marketing charges, administrative audit costs, and unpaid redemption settlements.
- Shares Outstanding: Total number of units held across all current investors.
                DAILY FORWARD PRICING MECHANISM

  Investor A inputs BUY order at 10:15 AM
  Investor B inputs SELL order at 02:45 PM
                         |
                         v Both orders held in queue
+----------------------------------------------------------------+
| 04:00 PM EST: Exchange Closes; Trading Halts                   |
+----------------------------------------------------------------+
                         |
                         v Accounting audit of all 500 stock prices
+----------------------------------------------------------------+
| 05:30 PM EST: Official Net Asset Value Computed (e.g., $45.20) |
+----------------------------------------------------------------+
                         |
                         v Both orders executed at EXACT SAME PRICE
  Investor A receives shares at $45.20 per share
  Investor B liquidates shares at $45.20 per share
Under forward-pricing rules enforced by SEC Rule 22c-1, any order submitted by an investor during the trading day receives the next computed NAV at 4:00 PM, preventing market timers from exploiting stale intraday prices.
Fund Structures: Open-End vs Closed-End vs ETFs
Pooled investment vehicles are classified into distinct structural categories based on their liquidity mechanisms and capitalization:
1. Open-End Funds (Traditional Mutual Funds)
- Capitalization: Dynamic. The fund issues new shares when capital enters and burns existing shares when investors redeem.
- Pricing: Transacted once daily at 4:00 PM NAV.
- Cash Drag: Must hold 2% to 5% of assets in cash or liquid Treasury bills to satisfy daily investor redemption requests without liquidating core securities.
2. Closed-End Funds (CEFs)
- Capitalization: Fixed. The fund raises a specific dollar amount during an initial public offering (IPO) and issues a fixed number of shares. No new shares are created or redeemed by the sponsor.
- Trading: Shares trade continuously on public secondary stock exchanges throughout the trading day like ordinary stocks.
- Premium / Discount to NAV: Because share supply is fixed, the secondary market price deviates from underlying NAV based on market sentiment:
$$\text{Premium / Discount %} = \frac{\text{Market Price} - \text{NAV}}{\text{NAV}} \times 100$$
A CEF holding $10.00 per share in bonds that trades at $9.20 on the exchange trades at an 8% discount to NAV.
3. Exchange-Traded Funds (ETFs)
ETFs blend the continuous exchange trading of closed-end funds with the flexible capitalization of open-end funds. Utilizing institutional intermediaries known as Authorized Participants (APs), ETFs create and redeem shares “in-kind” through custom baskets of securities, virtually eliminating the cash drag and embedded capital gains distributions inherent in traditional mutual funds.
       COMPARISON: POOLED FUND VEHICLE STRUCTURES

Feature         Open-End Mutual Fund     Closed-End Fund (CEF)    Exchange-Traded Fund (ETF)
----------------------------------------------------------------------------------
Trading Venue   Direct with Fund Trust   Public Stock Exchange    Public Stock Exchange
Execution Time  Once Daily (4:00 PM NAV) Continuous (Intraday)   Continuous (Intraday)
Capitalization  Fluctuating (Open-Ended) Fixed (IPO Shares)       Fluctuating (In-Kind)
Price vs NAV    Always Exact NAV         Trades at Disc / Prem    Tight Band around NAV
Cash Drag       Yes (Redemption Buffer)  Zero Cash Drag           Near Zero Cash Drag
Active vs Passive Management: Performance and Quantitative Metrics
The managed fund universe is bifurcated into active management and passive index replication:
1. Active Management Metrics
Active fund managers employ fundamental research, macroeconomic forecasting, and quantitative factor screens to select securities that outperform a stated benchmark index (such as the S&P 500 or Bloomberg US Aggregate Bond Index). Analysts evaluate active managers using risk-adjusted performance equations:
Jensen’s Alpha ($\alpha$): Measures the excess return generated by the manager above the return predicted by the Capital Asset Pricing Model (CAPM):
$$\alpha = R_P - \Big[ R_f + \beta_P (R_M - R_f) \Big]$$
Where $R_P$ is fund return, $R_f$ is the risk-free rate, $\beta_P$ is fund market sensitivity, and $R_M$ is benchmark market return.
Information Ratio (IR): Measures the manager’s ability to generate excess returns relative to a benchmark per unit of active risk (Tracking Error):
$$\text{IR} = \frac{R_P - R_B}{\text{Tracking Error}} = \frac{R_P - R_B}{\sqrt{\frac{1}{T-1} \sum_{t=1}^{T} (R_{P,t} - R_{B,t} - \overline{ER})^2}}$$
A sustained Information Ratio above 0.50 indicates top-quartile active investment skill.
2. The Active-to-Passive Structural Migration
Over the past two decades, academic research (such as the S&P Indices Versus Active scorecard, SPIVA) demonstrated that after deducting operating expenses and trading turnover costs, between 85% and 92% of active large-cap equity mutual funds underperform their benchmark index over a 15-year horizon.
This persistent underperformance triggered a historic reallocation of global assets toward low-cost passive index funds and ETFs pioneered by John Bogle and Vanguard.
                  FEE DRAG IMPACT OVER 30 YEARS

Initial Investment: $100,000 | Gross Annual Market Return: 8.00%
+----------------------------------------------------------------+
| Low-Cost Passive Index Fund (Expense Ratio: 0.05%):            |
| - Net Annual Compound Return: 7.95%                            |
| - Portfolio Value After 30 Years:                     $990,345 |
+----------------------------------------------------------------+
| High-Fee Active Mutual Fund (Expense Ratio: 1.25%):            |
| - Net Annual Compound Return: 6.75%                            |
| - Portfolio Value After 30 Years:                     $706,427 |
+----------------------------------------------------------------+
| Cumulative Fee Drag Paid to Fund Management:          $283,918 |
| (Over 28% of total potential wealth lost to operating fees)   |
+----------------------------------------------------------------+
Fund Expenses: The Total Expense Ratio (TER) and Share Classes
Mutual fund costs are summarized in the fund’s Total Expense Ratio (TER), deducted directly from fund assets before daily NAV is struck:
$$\text{Total Expense Ratio %} = \frac{\text{Management Fees} + \text{12b-1 Distribution Fees} + \text{Administrative Custody Fees}}{\text{Average Net Assets}} \times 100$$
Share Class Structures
Managed funds issue distinct share classes representing the same underlying investment portfolio, differing solely in fee allocation:
- Class A Shares: Charge an upfront sales commission (front-end load, typically 2.5% to 5.75%) paid to the selling financial advisor, with a lower ongoing annual expense ratio.
- Class C Shares: Feature zero upfront load but charge a high annual 12b-1 marketing fee (typically 1.00% annually), alongside a Contingent Deferred Sales Charge (CDSC) if liquidated within 12 months.
- Institutional (Class I) Shares: Carry zero front-end loads, zero 12b-1 distribution fees, and the lowest operating costs, but mandate substantial minimum investments ($1,000,000 or more).
Regulatory Protections: Diversification and Liquidity Rules
Regulators enforce strict concentration and liquidity mandates to safeguard pooled fund investors:
- The 5/10/40 Diversification Rule (UCITS and 1940 Act): A diversified fund cannot invest more than 10% of its net assets in securities issued by a single corporate entity. In conjunction, the total sum of all holdings that individually exceed 5% of net assets cannot exceed 40% of the aggregate portfolio.
- SEC Rule 22e-4 (Liquidity Risk Management Program): Open-end funds must classify all portfolio investments into four liquidity buckets (highly liquid, moderately liquid, less liquid, and illiquid). The rule legally prohibits mutual funds from acquiring any illiquid investment if the purchase causes illiquid assets to exceed 15% of total fund net assets.
Frequently Asked Questions
What happens to a managed fund’s NAV when it distributes capital gains or dividends?
When an open-end mutual fund pays a cash distribution (dividend or realized capital gain) of $1.50 per share to investors, the fund’s Net Asset Value (NAV) drops by exactly $1.50 on the ex-dividend date. Investors who elect automatic dividend reinvestment receive additional fractional shares of the fund at the new, lower NAV, keeping their total account dollar value unchanged.
Can an open-end managed fund ever halt redemption requests?
Under Section 22(e) of the US Investment Company Act of 1940, a mutual fund cannot suspend the right of redemption or postpone the date of payment for more than seven calendar days, except during formal emergency periods declared by the SEC, when the New York Stock Exchange is closed for trading, or during catastrophic financial events where normal trading is disrupted.
How does an open-end mutual fund differ from a unit investment trust (UIT)?
An open-end mutual fund maintains an active management team that continuously buys and sells securities to adjust to changing market conditions. A Unit Investment Trust (UIT) issues a fixed number of redeemable units tied to a static, unmanaged portfolio of stocks or bonds selected at inception and held unchanged until a predetermined statutory termination date, when the portfolio is liquidated and cash is returned to unit holders.
Ready to trade forex?
Open a free demo account with a regulated broker. Practice with virtual funds before risking real money.