Manufacturing Production
Manufacturing production is a primary macroeconomic indicator that measures the physical volume of output produced by manufacturing plants, factories, and processing facilities, representing the core component of total Industrial Production.
What Is Manufacturing Production?
Manufacturing production is a high-impact monthly economic metric that tracks the real physical output generated by manufacturing establishments across a national economy. Published by statistical agencies—such as the U.S. Federal Reserve Board, the European Union’s Eurostat, and Japan’s Ministry of Economy, Trade and Industry (METI)—manufacturing production comprises the vast majority (typically 70% to 78%) of a nation’s total Industrial Production (IP) index, with mining and public utilities (electric and gas) providing the remaining portion.
In foreign exchange and global macroeconomic analysis, manufacturing production serves as an essential coincident and leading indicator of economic health. Because manufacturing is capital-intensive and highly sensitive to central bank interest rate policies, business credit cycles, and cross-border trade demand, swings in factory output provide early warning signals of impending recessions or inflationary expansions well before quarterly Gross Domestic Product (GDP) reports are compiled.
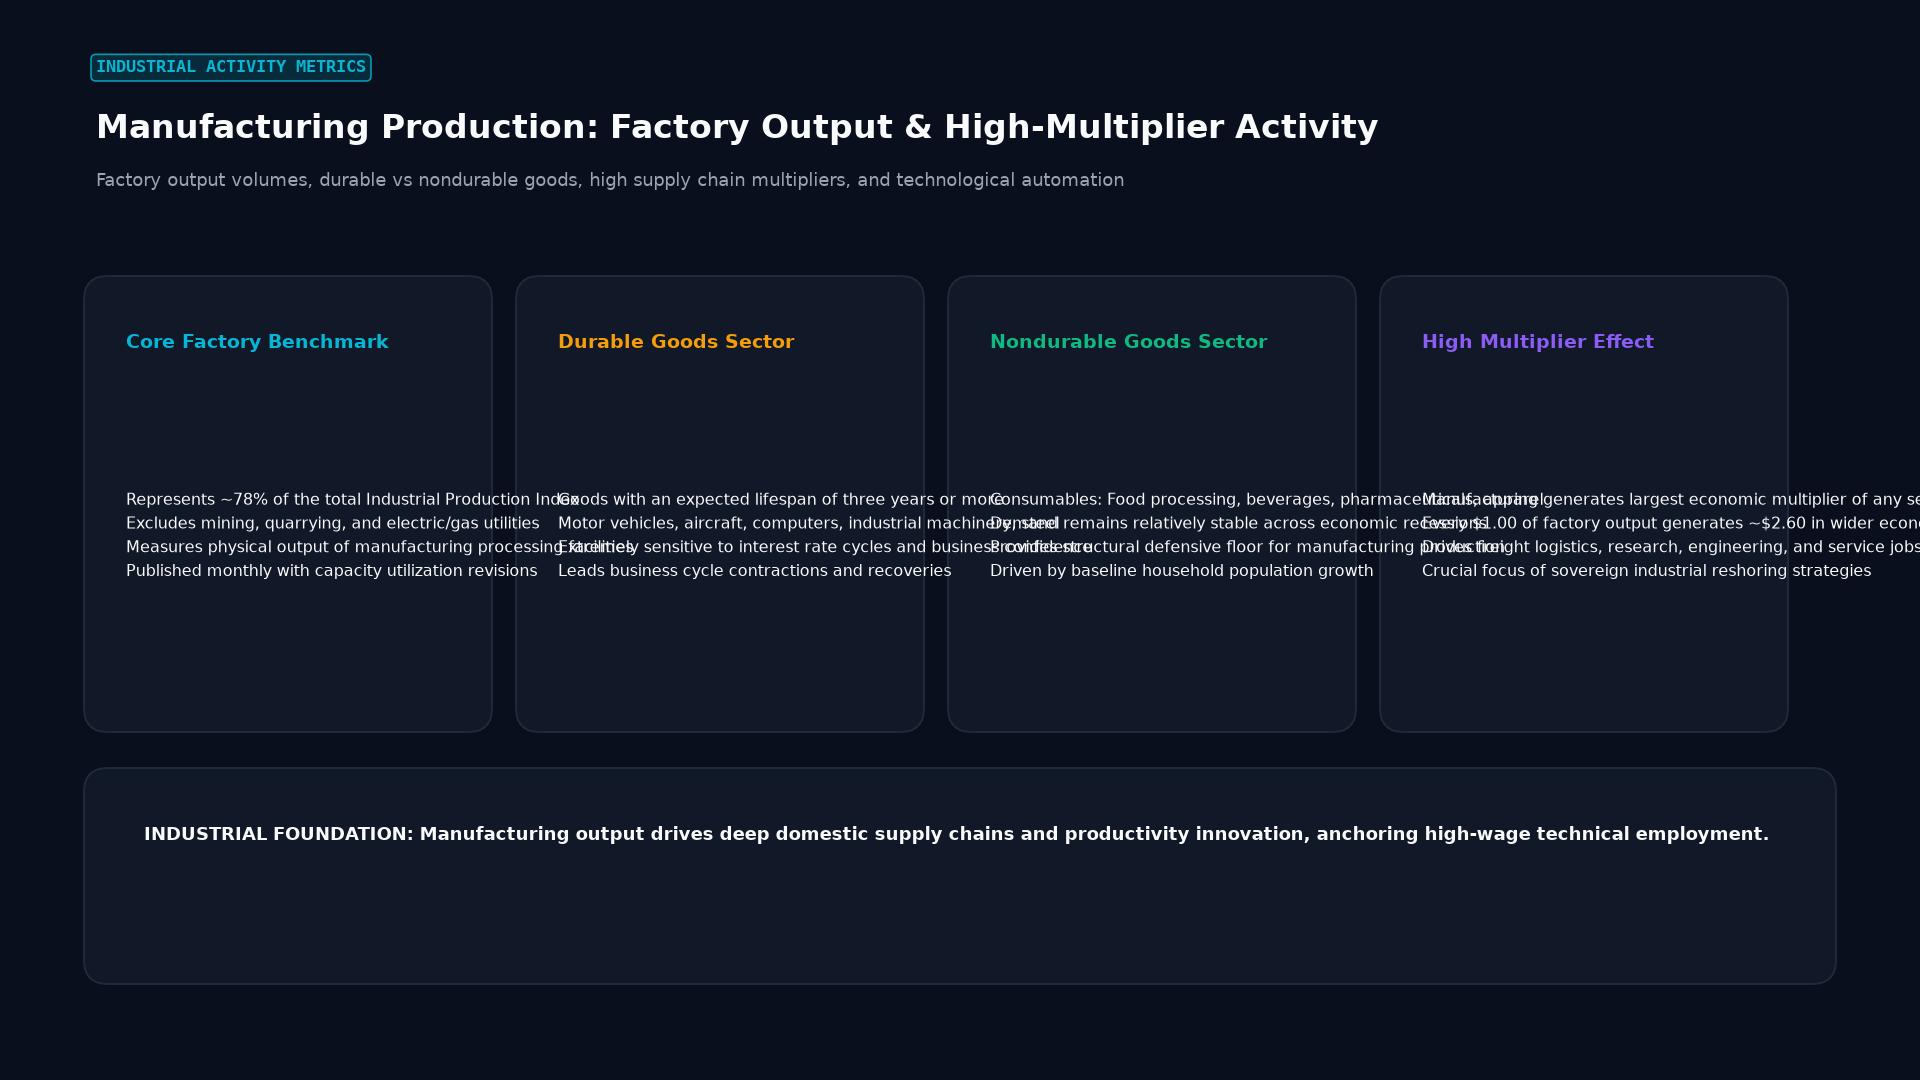 Figure: Factory output volumes, durable vs nondurable goods, high supply chain multipliers, and technological automation
Key Takeaways
- Dominant Component of Industrial Output: Manufacturing is the engine of the industrial sector, driving over three-quarters of total industrial production in modern developed nations.
- High Cyclical Sensitivity: Unlike the stable service sector (healthcare, government, education), manufacturing is heavily cyclical: demand for automobiles, construction equipment, and industrial machinery collapses rapidly during economic contractions and surges during recoveries.
- Capacity Utilization Link: Closely paired with the Capacity Utilization Rate; when factories operate above 80% to 85% capacity, supply chain constraints multiply, fueling cost-push producer price inflation.
- Export-Driven Currency Catalyst: For major export-driven economies—such as Germany (EUR), Japan (JPY), Switzerland (CHF), and South Korea (KRW)—manufacturing output is a primary fundamental driver of the national trade balance and currency strength.
- Hard Data vs. Soft Surveys: Manufacturing production is hard data (actual physical output measured in units or constant dollars), making it a crucial reality check against soft survey data like the Purchasing Managers’ Index (PMI).
Comparative Taxonomy: Manufacturing Output vs. Related Indicators
| Indicator | Data Classification | Frequency | Lead/Lag Characteristic | Market Impact Focus |
|---|---|---|---|---|
| Manufacturing Production | Hard Data (Actual factory output) | Monthly | Coincident | Verifies real physical production and inventory accumulation |
| Industrial Production (IP) | Hard Data (Factory + Mining + Utilities) | Monthly | Coincident | Broadest measure of total non-service industrial activity |
| Purchasing Managers’ Index (PMI / ISM) | Soft Data (Sentiment survey of executives) | Monthly | Leading | Earliest signal of future expansion or contraction (50 threshold) |
| Factory Orders (Durable Goods) | Hard Data (Value of new contracts booked) | Monthly | Leading | Predicts factory output for subsequent 3 to 6 months |
The Mathematics of the Manufacturing Production Index
Government statistical authorities compute the manufacturing production index as a chain-weighted Laspeyres or Fisher index, tracking physical volume rather than nominal dollar sales to filter out price inflation:
$$I_t = \sum_{i=1}^{n} w_{i,0} \left( \frac{Q_{i,t}}{Q_{i,0}} \right) \times 100$$
Where:
- $Q_{i,t}$ is the physical output of manufacturing industry $i$ in period $t$.
- $Q_{i,0}$ is the physical output in the benchmark base year.
- $w_{i,0}$ is the value-added weight of industry $i$ relative to total industrial value added.
When analyzing the report, institutional macro desks track both the month-over-month (MoM) change for near-term momentum and the year-over-year (YoY) percentage change to identify structural business cycle turning points.
Real-World Case Study: Germany’s Industrial Slump and EUR/USD (2022–2024)
Germany has historically been Europe’s manufacturing powerhouse, driven by its world-renowned automotive, chemical, and precision engineering sectors.
- The Catalyst: Following the 2022 geopolitical crisis in Ukraine, cheap Russian pipeline natural gas supplies to Germany were abruptly halted, causing industrial electricity and gas prices to spike to historic records.
- Manufacturing Collapse: High energy costs forced energy-intensive chemical and metal manufacturing plants to idle production lines. German manufacturing production fell into a severe, multi-year structural contraction, dropping over 8% below pre-pandemic levels by late 2023.
- Forex Impact: As German factory output slumped, the Eurozone’s industrial engine stalled, dragging the entire Euro area into economic stagnation.
- Market Divergence: In contrast, the U.S. economy benefited from domestic energy independence and manufacturing incentives (such as the CHIPS and Inflation Reduction Acts). This stark divergence in manufacturing health widened transatlantic yield spreads and exerted persistent downward pressure on EUR/USD, driving the pair toward parity.
Analytical Pitfalls for Currency Traders
- The Modern Service-Economy Bias: In modern post-industrial economies (such as the U.S. and UK), manufacturing accounts for only 10% to 12% of total nominal GDP, while services account for over 75%. A severe manufacturing slump can occur simultaneously with a robust consumer services boom, leading traders who look only at factory data to prematurely predict a broader national recession.
- Heavy Historical Revisions: Initial monthly manufacturing production releases are based on incomplete corporate survey samples and are routinely subject to substantial revisions in subsequent months.
- Inventory Disconnect: High manufacturing output is not inherently bullish if goods are simply piling up unsold in warehouses. Traders must cross-reference production numbers with Business Inventories and Retail Sales to ensure goods are actually being absorbed by final demand.
Frequently Asked Questions (FAQ)
What is the difference between durable and non-durable manufacturing goods?
Durable goods are manufactured products with an expected lifespan of three years or more, such as commercial aircraft, automobiles, industrial robotics, and home appliances. Non-durable goods are consumed quickly, such as pharmaceuticals, refined gasoline, packaged foods, and paper products. Durable goods production is far more sensitive to economic recessions.
How does manufacturing production influence central bank interest rates?
When manufacturing production expands rapidly and pushes capacity utilization above historical averages, it signals that the economy is running hot. Central banks often interpret this as a sign of emerging supply bottlenecks and inflationary wage pressures, prompting them to raise interest rates to cool economic growth.
Which country publishes the most market-moving manufacturing data?
The United States, through the Federal Reserve Industrial Production and Capacity Utilization report (released mid-month), and China, through the National Bureau of Statistics (NBS) Industrial Output release, produce the two most closely scrutinized manufacturing reports in global financial markets.
Ready to trade forex?
Open a free demo account with a regulated broker. Practice with virtual funds before risking real money.