Economic Indicator
An economic indicator is a macroeconomic statistical metric published by governmental statistical bureaus, central banks, or independent research institutes that quantifies economic performance, business cycle trajectory, and price stability.
What Is an Economic Indicator?
An economic indicator is a standardized piece of statistical data released on a regular schedule by sovereign government agencies (such as the U.S. Bureau of Labor Statistics or Eurostat), central banks, and private financial data providers (such as S&P Global). These figures quantify macroeconomic conditions, measuring economic variables such as consumer spending, employment generation, corporate sentiment, manufacturing output, and inflationary pressure.
In the global foreign exchange (FX) market, economic indicators represent the primary catalyst for fundamental price discovery and institutional volatility. Because currency valuations fundamentally reflect the relative macroeconomic strength, productivity, and interest rate paths of competing economies, currency traders monitor economic calendars around the clock to capitalize on macroeconomic surprises.
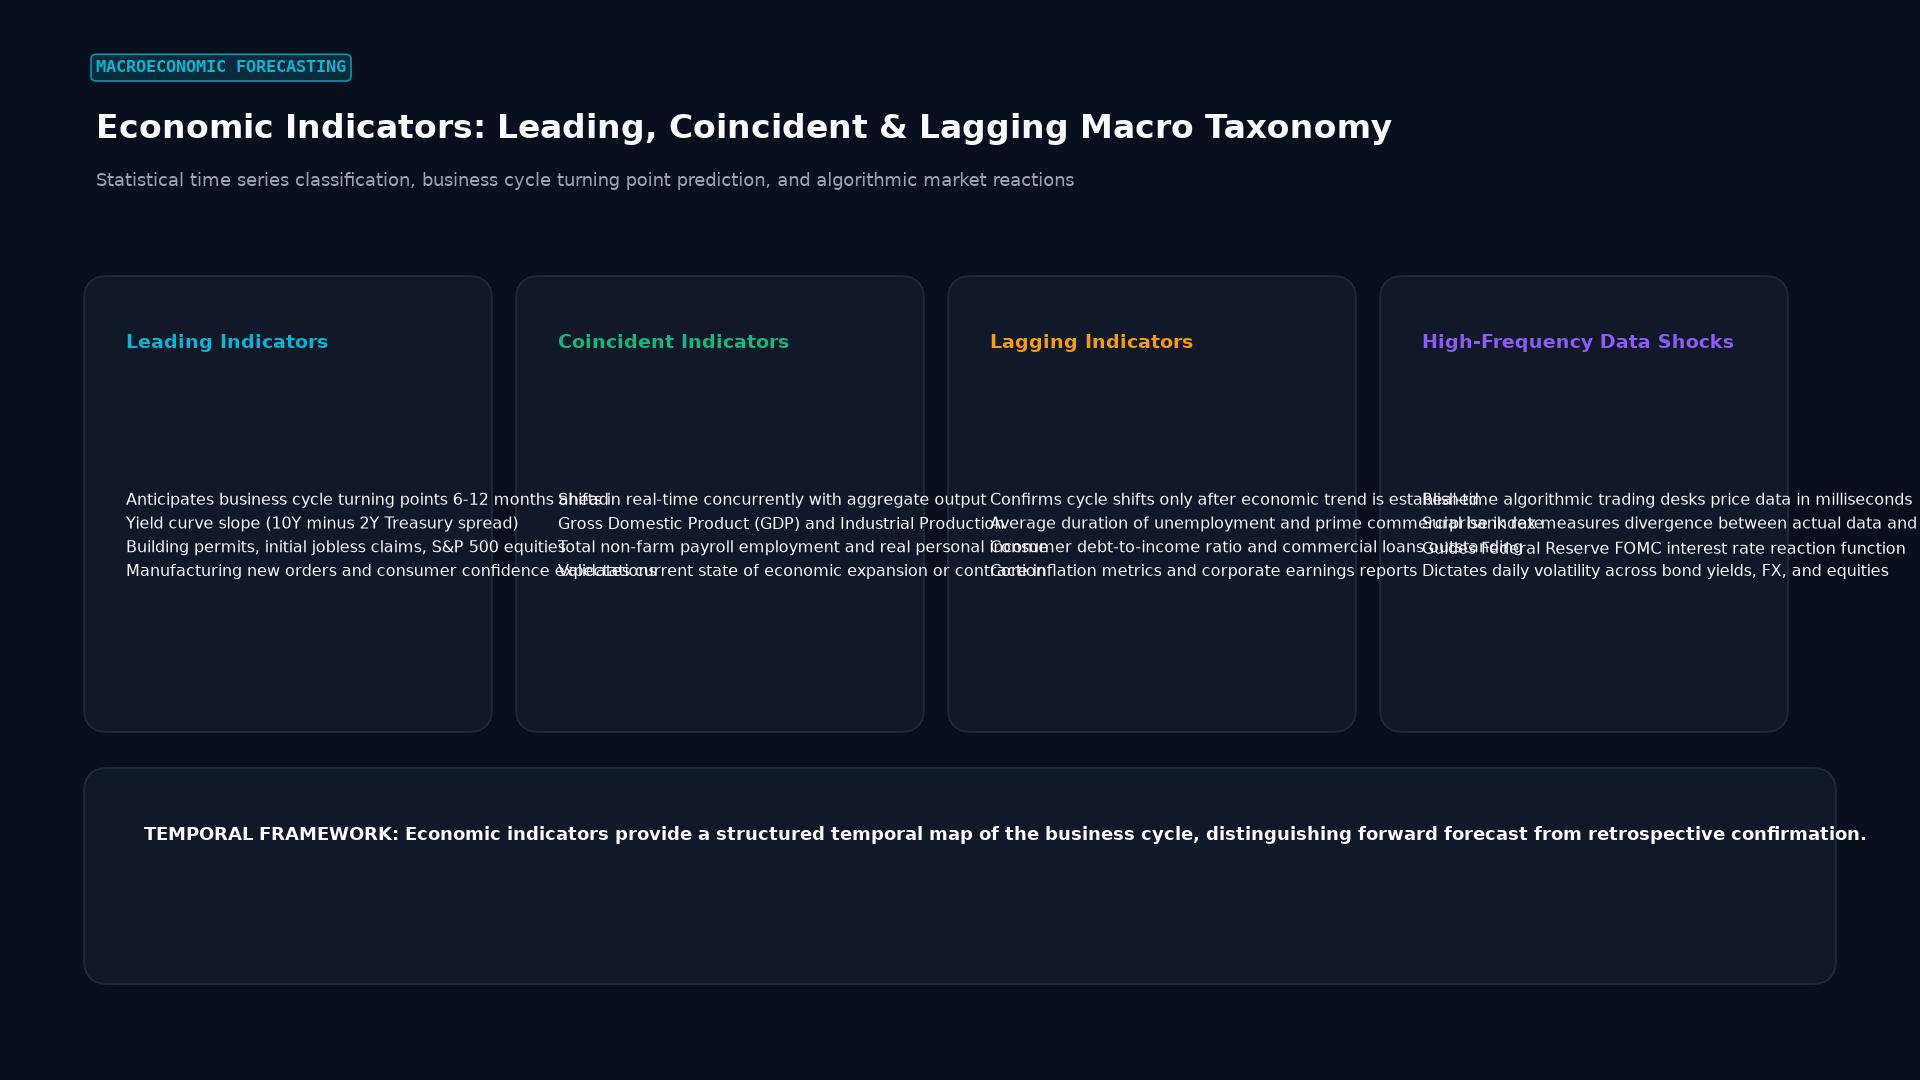 Figure: Statistical time series classification, business cycle turning point prediction, and algorithmic market reactions
Key Takeaways
- Three Temporal Classes: Indicators are categorized as leading (signaling future turns), coincident (reflecting current economic health), or lagging (confirming multi-month structural shifts).
- The “Consensus vs. Actual” Dynamic: Spot FX exchange rates do not move based on absolute figures; they move based on the variance between the published actual number and the prior institutional consensus forecast.
- Tier-1 Dominance: High-impact reports (such as U.S. Non-Farm Payrolls, Consumer Price Index, and Central Bank Interest Rate Decisions) can ignite 50 to 150-pip price spikes across major pairs within seconds.
- Liquidity Gaps and Spread Widening: During the immediate seconds surrounding a Tier-1 release, interbank market makers withdraw resting limit orders, causing bid-ask spreads to blow out and creating high slippage risks.
The Primary Economic Indicator Categories
1. Leading Indicators
Leading indicators provide advance notice of business cycle turning points before changes materialize in overall gross domestic product:
- Purchasing Managers’ Index (PMI): Monthly survey of supply-chain executives reflecting new orders, production, supplier deliveries, and employment. A reading above 50 indicates expansion; below 50 signals contraction.
- Yield Curve Inversion: When 2-year sovereign yields exceed 10-year yields, it historically serves as an authoritative leading harbinger of economic recession within 12 to 18 months.
- Building Permits & Housing Starts: Reflect forward-looking construction activity, credit demand, and mortgage commitments.
2. Coincident Indicators
Coincident indicators describe the contemporaneous state of economic activity as it happens:
- Gross Domestic Product (GDP): The broadest measure of total monetary market value of all finished goods and services produced within a country’s borders.
- Retail Sales: Tracks consumer retail spending, which accounts for roughly 70% of total economic activity in consumption-driven economies like the United States.
- Industrial & Manufacturing Production: Measures physical output from factories, mines, and utilities.
3. Lagging Indicators
Lagging indicators change only after the broader economy has already embarked on a sustained trend:
- Consumer Price Index (CPI) & Core PCE: Gauges price inflation for a representative basket of goods and services. Central banks set policy rates to keep inflation anchored near 2.0%.
- Unemployment Rate: Because employers typically fire staff or initiate hiring freezes only after a recession has commenced, unemployment lags economic contractions.
Tier-1 Global FX Indicators Overview
| Indicator | Publishing Agency | Release Frequency | Major Impacted Pairs | FX Impact Significance |
|---|---|---|---|---|
| Non-Farm Payrolls (NFP) | U.S. Bureau of Labor Statistics | 1st Friday monthly | EUR/USD, USD/JPY, GBP/USD | Massive immediate volatility; drives Fed rate hike/cut bets |
| Consumer Price Index (CPI) | National Statistical Bureaus | Monthly | All relevant currency pairs | Directly shifts real interest rate expectations and swap points |
| Central Bank Rate Decisions | Fed, ECB, BOJ, BOE, RBA, SNB | Every 6 to 7 weeks | Currency of issuing central bank | Changes immediate overnight carry cost and discount curves |
| S&P Global / ISM PMIs | ISM & S&P Global | 1st week monthly | Major crosses and G10 currencies | Gauges manufacturing health and forward economic momentum |
| Gross Domestic Product (GDP) | Bureau of Economic Analysis / Eurostat | Quarterly (3 releases) | Broad market indices and FX | Sets the structural long-term trend of sovereign currency strength |
The Economic Surprise Index & Deviation Trading
Institutional desk traders evaluate macroeconomic releases through the lens of standard deviations from consensus:
$$\text{Surprise Z-Score} = \frac{\text{Actual Value} - \text{Consensus Estimate}}{\text{Historical Standard Deviation of Errors}}$$
When an indicator prints with a positive Z-score $> +2.0$ (a major upside surprise):
- Traders instantly reprice higher benchmark policy rates for that currency.
- Algorithmic high-frequency trading (HFT) models fire market buy orders within milliseconds.
- The currency appreciates sharply against low-yielding peers.
The Citigroup Economic Surprise Index (CESI) tracks whether economic indicators for a country are systematically beating or missing consensus over rolling 3-month windows, signaling multi-week currency trend continuations or reversals.
Frequently Asked Questions
Why does a strong economic indicator sometimes cause a currency to fall?
In late-cycle inflationary environments, exceptionally strong economic data (such as high wage growth or booming consumer spending) can stoke fears of stagflation, trigger emergency central bank tightening, or induce risk-off equity selloffs. If global equity markets plunge into panic, safe-haven currencies like the U.S. Dollar or Swiss Franc may appreciate even if the data was published in a rival economy.
How do algorithmic news traders execute ahead of retail participants?
Institutional hedge funds and proprietary trading desks co-locate their servers inside exchange data centers (such as Equinix LD4 in London or NY4 in New Jersey). They pay for raw machine-readable data feeds directly from statistical agencies (e.g., Bloomberg machine feeds), allowing algorithms to parse headlines and execute trades in under 5 milliseconds—far faster than human comprehension.
What is the safest way for retail traders to handle Tier-1 releases?
Retail traders should generally avoid entering market orders immediately before or during the first 60 seconds of a Tier-1 release. The prudent strategy is to wait 5 to 15 minutes for initial algorithmic whip-saws to clear, assess the true fundamental deviation against market consensus, and trade confirmed momentum pullbacks with defined stop-losses.
Ready to trade forex?
Open a free demo account with a regulated broker. Practice with virtual funds before risking real money.