Oscillator
An oscillator is a technical analysis indicator that fluctuates within a bounded numerical range or across a zero centerline to measure price momentum, velocity, and acceleration, primarily utilized to detect overbought and oversold market extremes and momentum divergences.
What Is an Oscillator?
In technical analysis, an oscillator is a mathematical indicator calculated from historical price and volume data that oscillates over time within bounded limits (e.g., 0 to 100) or fluctuates around a central baseline (typically zero). Unlike trend-following overlays (such as moving averages or Bollinger Bands) that plot directly over price bars, oscillators are typically displayed in a secondary sub-window beneath the primary price chart.
Oscillators are engineered to quantify momentum—the velocity and magnitude of price changes. When prices accelerate rapidly in one direction, an oscillator travels toward its upper or lower extreme. By identifying when market momentum has outpaced sustainable buying or selling power, oscillators alert traders to potential exhaustion points, overextended ranges, and impending mean-reversion pullbacks.
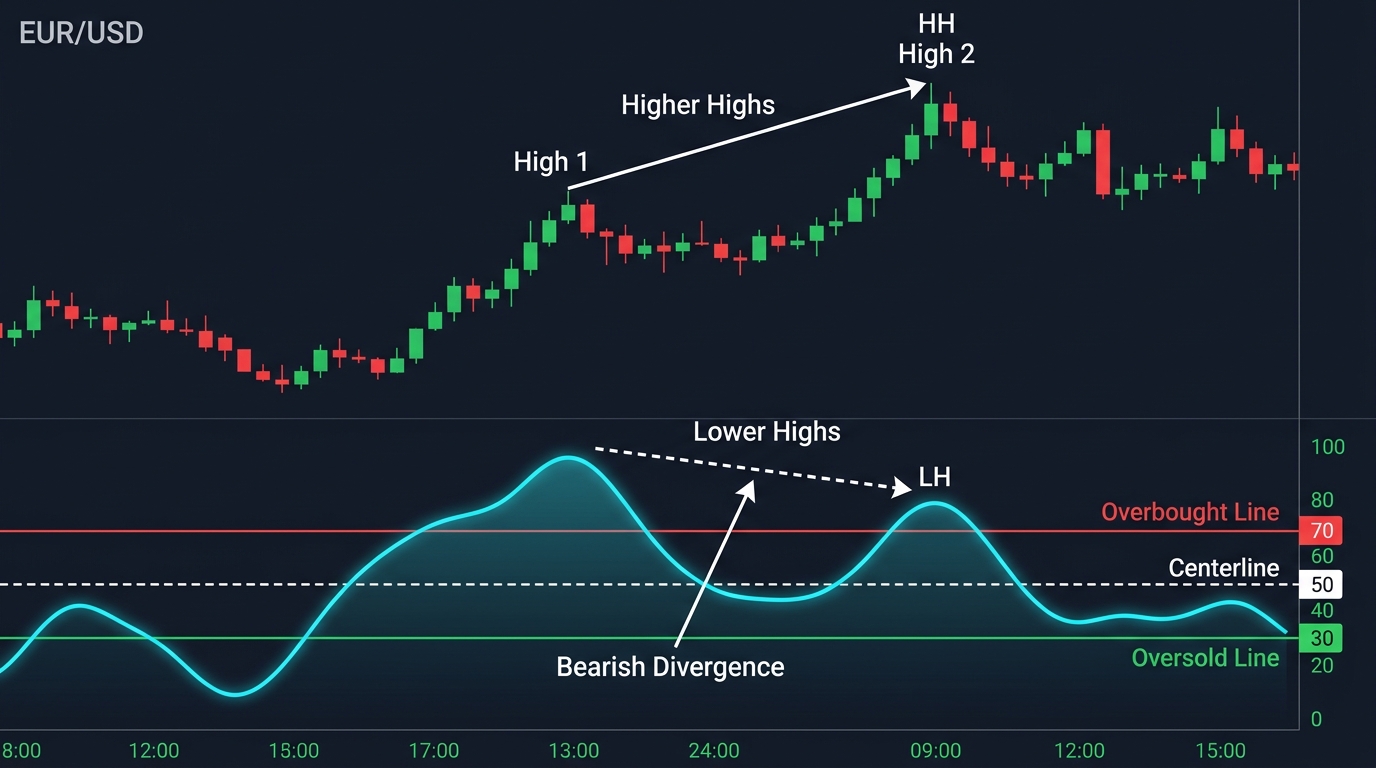
                      OSCILLATOR DYNAMICS & CHART ANATOMY

  Price Chart
  $1.1000 |                 /\  (Higher High)
  $1.0800 |     /\         /  \
  $1.0600 |    /  \       /    \
  --------+---+----+-----+------+-------------------------> Time

  Bounded Oscillator (e.g., RSI)
      100 + - - - - - - - - - - - - - - - - - - - - - - - - - -
       70 |    /\ (Overbought)       (Bearish Divergence)
          |   /  \           /\
       50 | -/- - \ - - - - / - \ - - - Centerline - - - - -
       30 |  /     \       /     \ (Oversold)
        0 + - - - - - - - - - - - - - - - - - - - - - - - - - -
Bounded vs. Unbounded Oscillators
Oscillators are broadly categorized into two structural architectures based on their mathematical boundaries:
1. Bounded (Range-Bound) Oscillators
These indicators are mathematically normalized to fluctuate strictly within a fixed numerical band (usually 0 to 100). Because the boundaries are absolute, traders can establish standardized statistical thresholds for overbought and oversold conditions:
- Relative Strength Index (RSI): Normalized momentum index developed by J. Welles Wilder Jr. (Overbought > 70; Oversold < 30).
- Stochastic Oscillator: Developed by George Lane, comparing the closing price to the high-low range over a specified lookback period (Overbought > 80; Oversold < 20).
- Commodity Channel Index (CCI): Normalized statistical variation from the mean (Overbought > +100; Oversold < -100).
2. Unbounded (Centered) Oscillators
Centered oscillators fluctuate above and below a central baseline (zero line) without fixed upper or lower mathematical ceilings. They measure whether short-term momentum is accelerating faster or slower than long-term baseline momentum:
- Moving Average Convergence Divergence (MACD): Measures the distance between a short-term exponential moving average (12-period EMA) and a long-term EMA (26-period EMA).
- Rate of Change (ROC): Measures the percentage change between the current closing price and the price $n$ periods ago.
- Awesome Oscillator (AO): The difference between a 5-period and 34-period simple moving average of bar midpoints.
Technical Comparison of Major Financial Oscillators
The following table contrasts the core mathematical properties and primary applications of widely deployed trading oscillators:
| Oscillator | Architecture | Range / Center | Formula Summary | Best Market Condition |
|---|---|---|---|---|
| RSI | Bounded | 0 to 100 (Mid: 50) | $100 - \left[\frac{100}{1 + \frac{\text{Avg Gain}}{\text{Avg Loss}}}\right]$ | Ranging and trending markets; divergence detection. |
| Stochastic (%K, %D) | Bounded | 0 to 100 (Mid: 50) | $%K = \left[\frac{C - L_{14}}{H_{14} - L_{14}}\right] \times 100$ | Sideways consolidation channels; quick turning points. |
| MACD | Unbounded | Center: 0.0 | $\text{EMA}{12} - \text{EMA}{26}$ | Trend-following momentum; centerline crossovers. |
| CCI | Quasi-Bounded | Center: 0 (Bands: $\pm 100$) | $\frac{\text{Typical Price} - \text{SMA}}{0.015 \times \text{Mean Deviation}}$ | Cyclical turning points; multi-asset commodities & FX. |
| Williams %R | Bounded (Inverted) | -100 to 0 (Mid: -50) | $\frac{H_{14} - C}{H_{14} - L_{14}} \times (-100)$ | Overextended intraday scalping; rapid reversal signals. |
Primary Trading Signals Generated by Oscillators
Professional traders utilize oscillators for three distinct analytical signals:
- Overbought and Oversold Extremes: When a bounded oscillator enters an extreme zone (e.g., RSI > 70), it signals that buying pressure is statistically stretched. In ranging markets, this serves as an effective counter-trend mean-reversion signal.
- Centerline Crossovers: A cross above the centerline (50 for RSI, 0 for MACD) confirms that bullish momentum has seized control, validating trend-continuation setups.
- Momentum Divergences: Occur when price prints a higher high (or lower low), but the oscillator fails to confirm the move by printing a lower high (or higher low). Divergences frequently precede significant macro market reversals.
The Trending Market Trap: Oscillator “Pegging”
The most hazardous limitation of oscillators is their tendency to remain pinned at extremes during strong, sustained trends:
$$\text{Strong Bull Market} \implies \text{RSI remains above 70 for weeks}$$
Traders who blindly execute counter-trend short trades simply because an oscillator reaches an “overbought” threshold frequently suffer devastating losses in parabolic markets. In powerful institutional trends, an overbought reading does not indicate a reversal; it confirms exceptional trend strength. Consequently, disciplined traders filter oscillator signals using higher-timeframe trend indicators (such as the 200-day moving average).
Real-World Case Study: Bearish RSI Divergence on GBP/USD
During a multi-month rally in early 2021, the British Pound (GBP/USD) surged higher on vaccine rollout optimism.
- Price Action: GBP/USD formed a swing high at 1.3760 in late January, pulled back, and then rallied aggressively to a new higher swing high of 1.4240 on February 24, 2021.
- Oscillator Behavior (Daily 14-period RSI):
- At the first high of 1.3760, RSI surged to an overbought peak of 77.5.
- At the second higher high of 1.4240, RSI only reached 68.2, forming a pronounced Regular Bearish Divergence.
- Analysis: Although price achieved a substantial new high (+480 pips), internal buying velocity and rate-of-change had decayed significantly.
- The Reversal: Within days, GBP/USD broke below its 20-day moving average and collapsed over 550 pips, dropping back to 1.3670 by mid-April.
Frequently Asked Questions
Which oscillator is best for beginner traders?
The 14-period Relative Strength Index (RSI) is widely considered the best foundational oscillator. Its normalized 0–100 scale, clear 50-level centerline, and proven reliability for divergence identification make it accessible and robust across all asset classes.
How do oscillators differ from trend-following indicators?
Trend-following indicators (like Moving Averages and ADX) identify the presence and direction of an established trend, lagging price to filter out noise. Oscillators lead price by measuring the rate of change and speed of momentum, performing best in sideways, range-bound market environments.
Can oscillators be used on intraday timeframes (e.g., 5-minute charts)?
Yes, oscillators operate identically on intraday charts (1-minute, 5-minute, 15-minute). However, because intraday charts contain substantial market noise and bid-ask microstructure friction, intraday oscillator signals generate higher false-positive rates unless aligned with daily higher-timeframe market structure.
Ready to trade forex?
Open a free demo account with a regulated broker. Practice with virtual funds before risking real money.