Divergence
Divergence is a technical analysis pattern that occurs when the price of an asset and a technical momentum indicator (such as RSI, MACD, or Stochastic) move in opposite directions. It signals that the prevailing price trend is losing underlying momentum, foreshadowing a potential reversal or continuation.
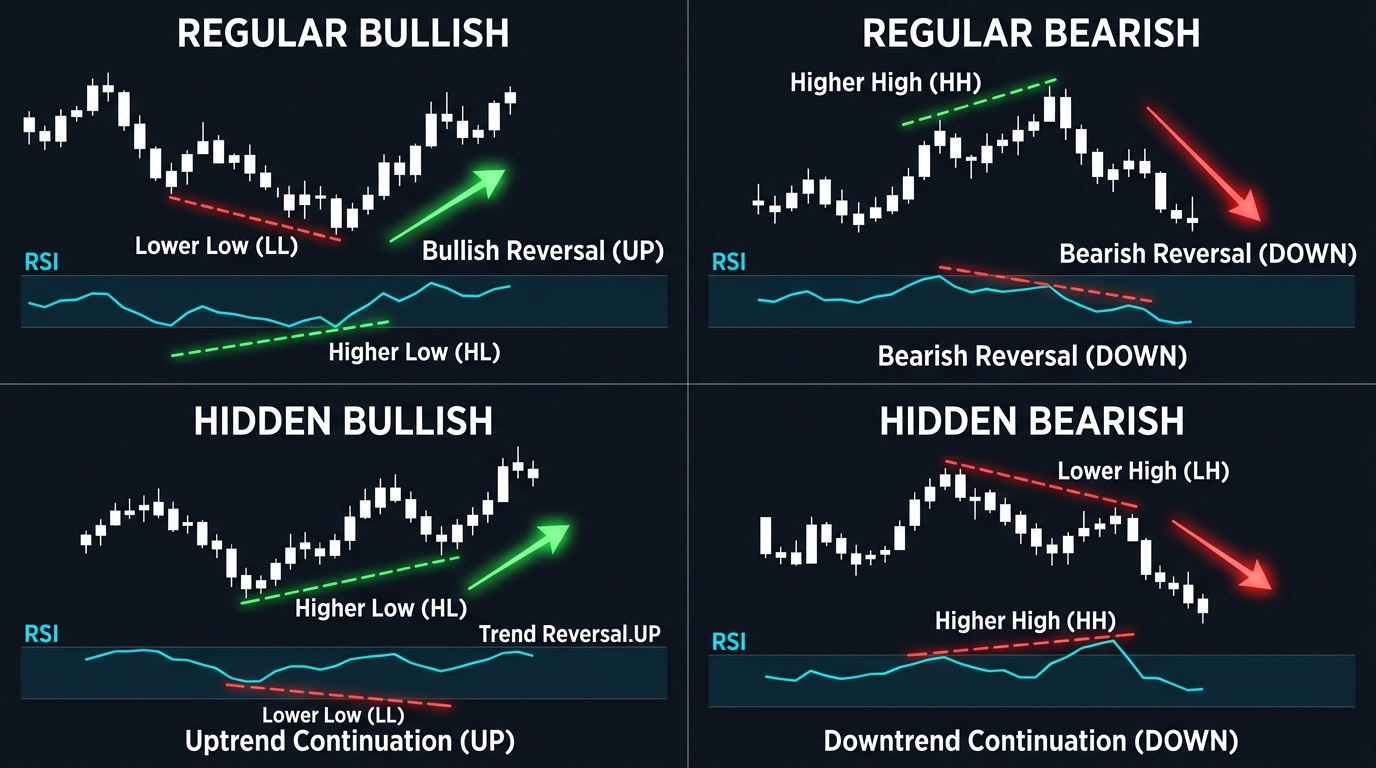
What Is Divergence in Technical Analysis?
In financial charting and technical analysis, divergence occurs when the price action of an asset and the trajectory of a mathematical momentum oscillator fall out of alignment.
Under normal, healthy market conditions, price and momentum travel in harmony. In a sustainable uptrend, as price pushes higher to print consecutive higher highs, the momentum indicator should also register higher highs, confirming that buying pressure is expanding. In a healthy downtrend, price and momentum simultaneously print lower lows.
When divergence appears, this harmony breaks down:
- The price makes a new high, but the indicator fails to make a new high.
- Alternatively, the price makes a new low, but the indicator refuses to make a new low.
This visual discrepancy serves as an X-ray of market momentum. It reveals to technical analysts that beneath the surface of the visible price candles, the underlying velocity of orders and institutional buying or selling power is rapidly decaying, foreshadowing an impending market turning point.
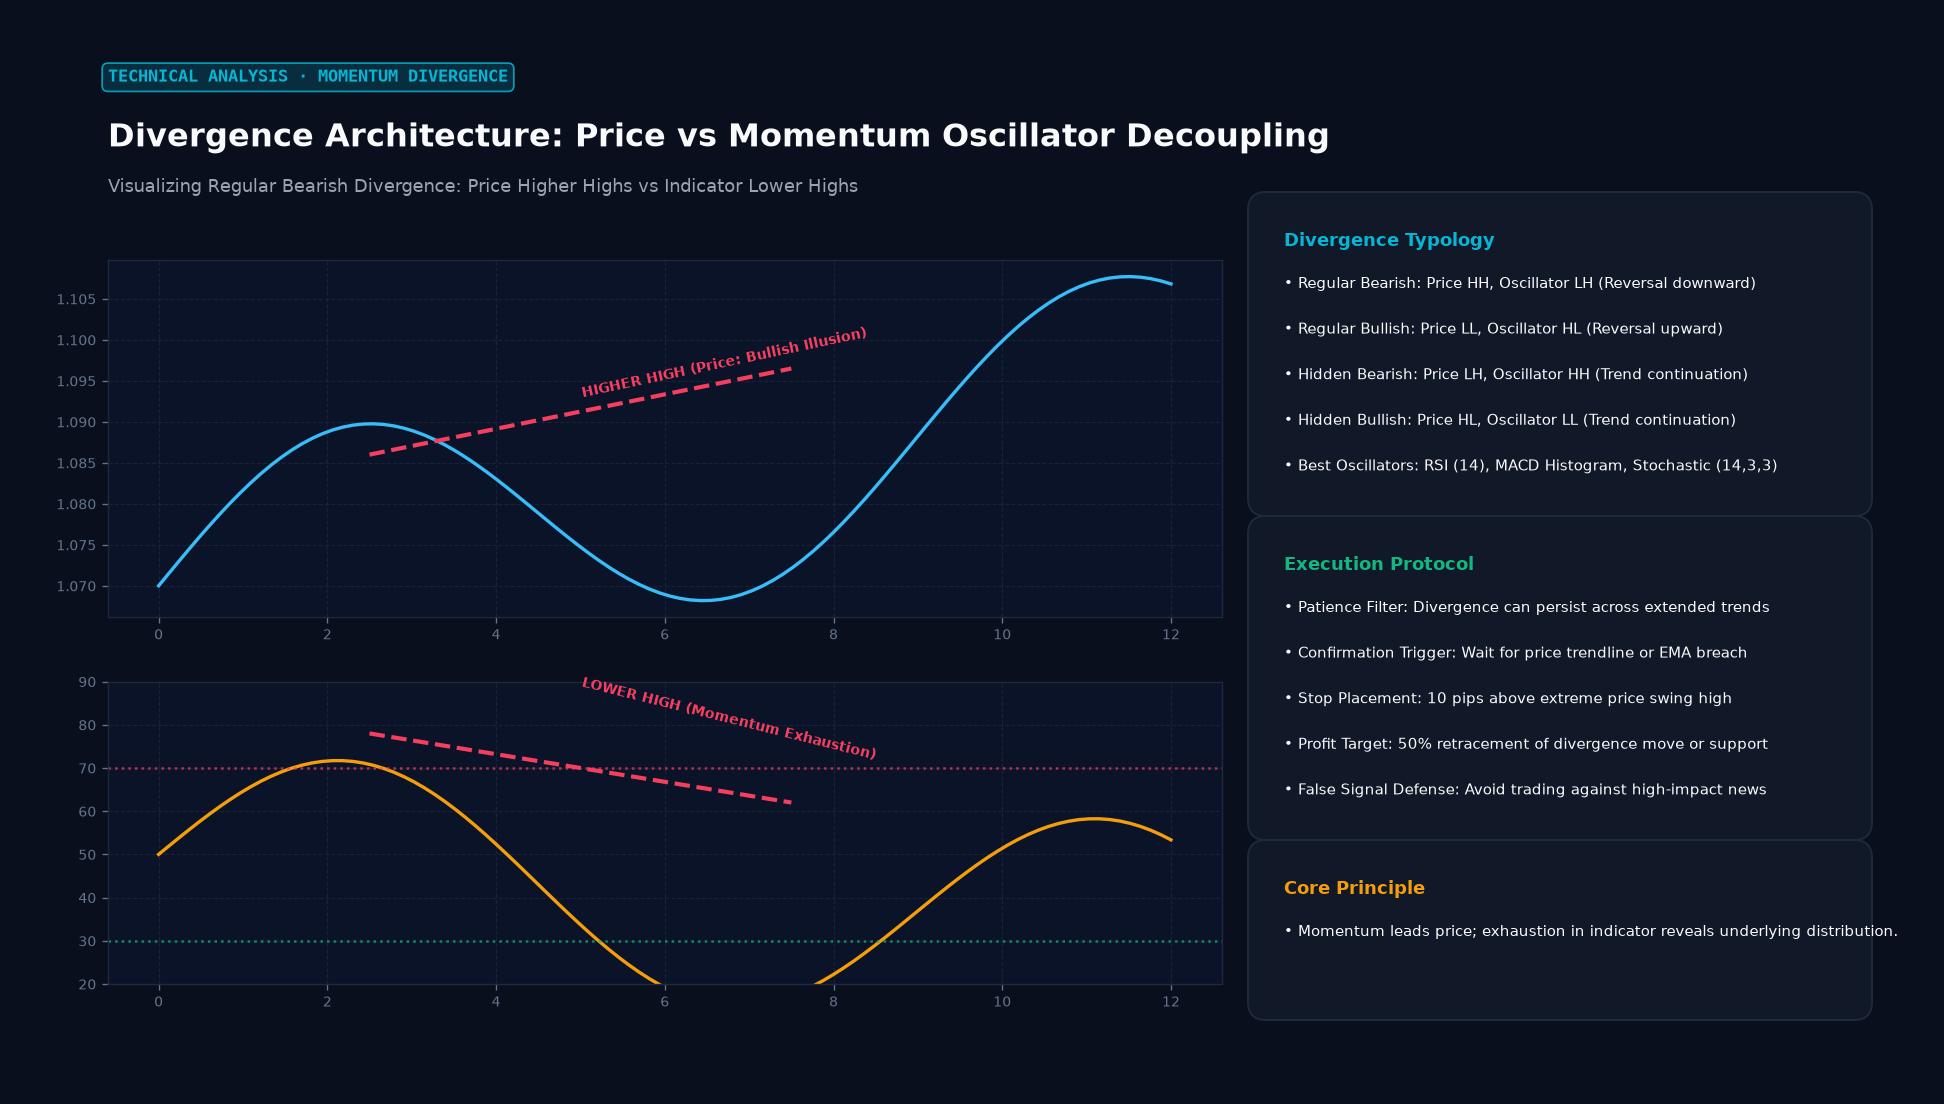 Figure: Visualizing Regular Bearish Divergence: Price Higher Highs vs Indicator Lower Highs
Regular vs. Hidden Divergence: The Two Main Families
Technical analysts categorize divergences into two distinct operational classes based on whether the signal forecasts a trend reversal or a trend continuation:
1. Regular (Classic) Divergence: Reversal Signal
Regular divergence warns that an existing, mature trend has run out of steam and is preparing to reverse direction:
- Regular Bullish Divergence:
- Price Action: Forms a Lower Low (LL).
- Oscillator Action: Forms a Higher Low (HL).
- Interpretation: Even though price managed to undercut previous lows, selling pressure was significantly weaker on the second push. Bears are exhausted, and an upward price reversal is imminent.
- Regular Bearish Divergence:
- Price Action: Forms a Higher High (HH).
- Oscillator Action: Forms a Lower High (LH).
- Interpretation: Price reached a higher nominal peak, but the momentum driving the move was weaker than on the previous swing. Buyers are struggling to sustain higher valuations, warning of an impending downward collapse.
2. Hidden Divergence: Continuation Signal
While regular divergence signals that a trend is dying, hidden divergence signals that the primary trend is healthy and that a temporary counter-trend pullback has concluded, offering a high-probability entry in the direction of the dominant trend:
- Hidden Bullish Divergence (In an Uptrend):
- Price Action: Forms a Higher Low (HL) (a normal corrective pullback in a bull market).
- Oscillator Action: Plunges deeply to form a Lower Low (LL).
- Interpretation: The indicator has completely reset its oversold condition without price giving up its structural gains. Bulls retain dominance, signaling that the primary uptrend will resume.
- Hidden Bearish Divergence (In a Downtrend):
- Price Action: Forms a Lower High (LH) (a normal corrective rally in a bear market).
- Oscillator Action: Surges upward to form a Higher High (HH).
- Interpretation: Counter-trend buying momentum was exhausted while price remained unable to breach resistance. The primary downtrend is poised to resume.
Divergence Quick-Reference Summary Table
| Divergence Type | Market Context | Price Action | Indicator Action | Market Forecast |
|---|---|---|---|---|
| Regular Bullish | Downtrend bottom | Lower Low (LL) | Higher Low (HL) | Bullish Reversal (Up) |
| Regular Bearish | Uptrend peak | Higher High (HH) | Lower High (LH) | Bearish Reversal (Down) |
| Hidden Bullish | Uptrend pullback | Higher Low (HL) | Lower Low (LL) | Trend Continuation (Up) |
| Hidden Bearish | Downtrend rally | Lower High (LH) | Higher High (HH) | Trend Continuation (Down) |
The Best Indicators for Trading Divergence
Divergence can be identified using any bounded momentum oscillator, but three indicators are considered the industry standard:
- Relative Strength Index (RSI - 14 Period): The most popular oscillator for divergence analysis. Because RSI measures the ratio of upward changes to downward changes on a 0-to-100 scale, structural swings on the RSI line are clean and easily matched against price peaks.
- Moving Average Convergence Divergence (MACD): Traders identify divergence by examining both the MACD Line and the MACD Histogram. A histogram divergence (where bars shrink while price makes a new high) provides an exceptional leading indicator of momentum deceleration.
- Stochastic Oscillator (14, 3, 3): Highly sensitive to short-term cyclical turning points, favored by intraday scalpers on 5-minute and 15-minute charts.
Avoiding the “Divergence Trap”: Essential Confirmation Rules
A classic mistake among novice traders is entering a position immediately upon spotting a divergence. In powerful, news-driven parabolic trends, divergence can persist for days or weeks while price continues rallying or crashing hundreds of pips, liquidating premature counter-trend positions.
Professional traders treat divergence as a warning setup, never as an execution trigger. To trade divergence safely, demand three confirmation filters:
- Horizontal Confluence: Ensure the divergence forms directly at a major multi-day support or resistance zone, a key Fibonacci retracement level, or a major round number.
- Break of Market Structure (BOS): Wait for price to break through a local swing high or swing low (or penetrate a short-term trend line) before entering.
- Candlestick Reversal Confirmation: Require a confirming price pattern—such as an engulfing candlestick, a pin bar rejection, or a morning/evening star formation—confirming that institutional buyers or sellers have actively entered the market.
Practical Trading Example: Regular Bearish Divergence on EUR/USD
Consider a swing trader analyzing the 4-Hour chart of EUR/USD:
- Market Setup: EUR/USD is in an extended uptrend. Price rallies from 1.0750 to hit a peak at 1.0900. The 14-period RSI reaches an overbought reading of 78.0.
- The New High: Price pulls back to 1.0830, consolidates, and then surges into a second bullish leg, printing a new high at 1.0960 (+60 pips higher).
- Spotting the Divergence: Looking down at the RSI indicator during this new high, the trader notices the RSI reaches only 66.0 (a clear Lower High). Price made a Higher High (1.0960 vs 1.0900), but RSI made a Lower High (66.0 vs 78.0)—confirming Regular Bearish Divergence.
- Execution Trigger: The trader does not short immediately at 1.0960. Instead, they wait. Two bars later, EUR/USD prints a massive bearish engulfing candle that breaks below the local upward trend line at 1.0925.
- Trade Execution: The trader enters a short position at 1.0920 on the candle close.
- Risk Management: The stop-loss is placed safely 15 pips above the swing high at 1.0975 (55 pips risk).
- Target: Placed at the origin of the move near major support at 1.0760 (160 pips reward).
- Outcome: The trend reversal unfolds cleanly, hitting the 1.0760 target over the next week and delivering an exceptional 2.9:1 reward-to-risk return.
Key Takeaways
- Divergence occurs when an asset’s price and its momentum oscillator move in opposite directions.
- Regular divergence signals that the current trend is exhausted and an impending reversal is approaching.
- Hidden divergence signals that a corrective pullback has ended and the dominant trend is about to resume.
- RSI, MACD, and Stochastics represent the premier technical oscillators for divergence detection.
- Never trade divergence blindly in isolation; require structural confirmation through trend line breaks and reversal candlestick patterns.
FAQ
Can divergence fail? Yes. In strong macroeconomic trends driven by central bank interest rate shocks, momentum can remain overbought or oversold for extended periods. A divergence signal can be erased if institutional volume re-accelerates in the direction of the original trend.
Which timeframe is most reliable for divergence trading? Higher timeframes (such as the 4-Hour, Daily, and Weekly) provide the most reliable divergence signals because they filter out intraday order noise and represent multi-week institutional accumulation or distribution.
What is the difference between regular and hidden divergence? Regular divergence compares the extreme peaks and valleys of a trend to anticipate a complete reversal (counter-trend). Hidden divergence compares the pullbacks within an ongoing trend to join the existing direction (trend-following).
Ready to trade forex?
Open a free demo account with a regulated broker. Practice with virtual funds before risking real money.