Oversold
Oversold describes a market condition where an asset's price has suffered a rapid, persistent, and mathematically extreme decline without intermediate consolidation, pushing technical momentum oscillators into lower statistical thresholds and indicating that selling momentum is overextended and vulnerable to a corrective bounce or trend reversal.
What Does Oversold Mean?
In financial market technical analysis, oversold designates an extreme condition where aggressive, one-sided selling pressure has driven an asset’s price down to an unsustainable statistical deviation from its underlying equilibrium. When an asset becomes deeply oversold, the market has discounted bad news, panic liquidations, or margin-call capitulation to such a degree that available sellers are depleted, creating favorable conditions for a sharp mean-reversion bounce, short-covering rally, or cyclical accumulation by institutional value investors.
Oversold levels are primarily identified using momentum oscillators (such as the Relative Strength Index, Stochastic Oscillator, or Money Flow Index) and statistical channel bands (such as Keltner Channels or Bollinger Bands).
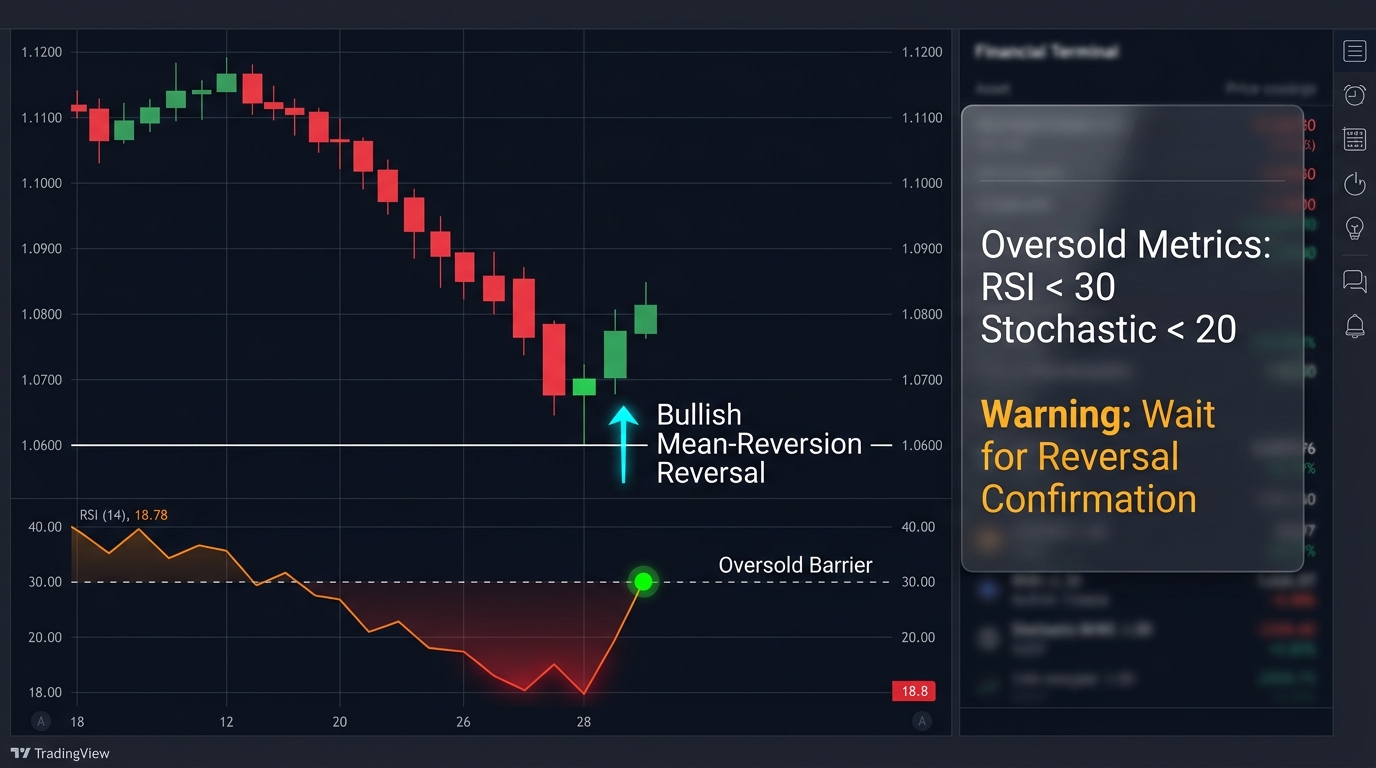
                      OVERSOLD CAPITULATION DYNAMICS

  Price Action ($)
  1.1200 |       * * * *
  1.1000 |               * * * *
  1.0800 |                       * * * *
  1.0600 |                               * (Capitulation Low / Reversal)
  -------+-------+-------+-------+-------+-------------------> Time

  RSI (14-Period)
     100 + - - - - - - - - - - - - - - - - - - - - - - - - - -
      70 |     * * * *
      50 |             * * * *
      30 | - - - - - - - - - - * - - - - - - Oversold Line - -
      20 |                       * * * * (Deeply Oversold)
       0 + - - - - - - - - - - - - - - - - - - - - - - - - - -
Technical Indicators for Detecting Oversold Levels
Quantitative analysts and technical traders utilize standardized thresholds across major oscillators to gauge oversold extremes:
| Indicator | Oversold Threshold | Calculation Basis | Practical Market Interpretation |
|---|---|---|---|
| Relative Strength Index (RSI) | RSI < 30 (or < 20 in extreme panic) | Ratio of smoothed average gains to smoothed average losses over 14 bars. | Selling velocity has reached statistical exhaustion; monitor for bullish reversal patterns. |
| Stochastic Oscillator | %K or %D < 20 | Closes near the lowest price of the lookback range (14 periods). | Downward momentum is compressed; high probability of a relief bounce in ranges. |
| Bollinger Bands | Price touching / breaching Lower Band (-2$\sigma$) | Evaluates price standard deviations below the 20-period moving average. | Downside extension reaches the bottom 2.5% of standard probability distribution. |
| Commodity Channel Index (CCI) | CCI < -100 (or < -200) | Statistical distance of typical price from simple moving average. | Deep cyclical negative impulse; prime candidate for mean-reversion. |
| Williams %R | %R between -80 and -100 | Measures current close relative to the high of the past 14 periods. | Selling momentum has reached absolute extreme lower boundary. |
The Falling Knife Hazard: Oversold in a Bear Trend
A fundamental pitfall for inexperienced traders is attempting to “catch a falling knife” by buying an asset simply because its RSI or Stochastic has crossed into oversold territory.
In modern electronic markets:
- Strong Bear Trends Stay Oversold: When an economy enters a severe recession, a company faces corporate fraud, or a sovereign currency suffers capital flight, prices can fall relentlessly. In such regimes, the RSI can remain pinned below 30 (or even below 15) for weeks as margin calls trigger automated liquidations.
- Capitulation Sells: Heavy institutional selling often accelerates after an asset crosses below 30 RSI, as risk parity funds and CTA trend-followers add to short positions on trend-breakdown triggers.
- Consolidation Without Price Recovery: An oversold oscillator can reset all the way back to the neutral 50 level simply through sideways consolidation, without the market price gaining a single pip, leaving early buyers trapped in underwater positions.
       OVERSOLD PINNING VS. BULLISH REVERSAL CONFLUENCE

  [Bearish Continuation]    RSI < 30 ---> Price continues plunging another -400 pips!
                                          (Oversold = Bearish Momentum Confirmation)

  [True Reversal Setup]    RSI < 30 ---> Bullish Divergence (Higher RSI trough)
                                          + Breakout above Prior Swing High
                                          (Oversold + Market Structure Shift = Buy Signal)
Strategic Framework for Trading Oversold Markets
To exploit oversold market inefficiencies profitably, institutional traders implement rigorous multi-step confirmation rules:
1. Wait for the Oscillator Recovery Cross
Never buy while the oscillator is falling deeper into the oversold zone. Wait until the indicator curls upward and crosses back above the threshold line (e.g., RSI crosses above 30). This confirms that selling momentum has decelerated and buyers have begun entering the market.
2. Bullish Momentum Divergence
Look for a Regular Bullish Divergence, where price prints a Lower Low while the oscillator prints a Higher Low. This proves that downside velocity is dissipating despite the lower nominal price.
3. Key Structural Support Confluence
An oversold reading is vastly more reliable when it occurs directly at a major multi-year support level, psychological round number, daily ascending trendline, or high-volume node on a Volume Profile chart.
Real-World Case Study: The October 2022 EUR/USD Bottom
In late September and October 2022, the European energy crisis, soaring inflation, and aggressive Federal Reserve rate hikes drove EUR/USD down to a 20-year low of 0.9535.
- Oversold Signals: On the Daily chart, the 14-period RSI collapsed into extreme oversold territory, dropping below 24.0.
- The Divergence Setup:
- On September 28, EUR/USD hit an initial panic low of 0.9535 with daily RSI at 23.8.
- Over the following three weeks, price retested the lows, printing a secondary low of 0.9630 in late October, but the daily RSI failed to confirm, printing a higher trough at 34.5.
- The Structural Breakout: EUR/USD broke above its 50-day moving average and cleared the swing pivot of 0.9900, confirming a textbook Bullish Divergence.
- The Result: The oversold capitulation marked the definitive macro bottom. EUR/USD embarked on a massive 1,500-pip rally, surging past 1.1000 over the following six months.
Frequently Asked Questions
What does “oversold bounce” mean?
An “oversold bounce” (often called a “dead cat bounce” or short-covering rally) is a temporary upward price reaction that occurs after an extreme sell-off. As short-sellers buy back contracts to lock in profits and counter-trend scalpers enter, prices rebound briefly before either establishing a bottom or resuming the larger downtrend.
How do oversold conditions differ in stock markets versus foreign exchange?
In equity markets, individual stocks can drop to zero during corporate bankruptcy, making oversold dip-buying dangerous without fundamental analysis. In spot forex, currencies represent sovereign nations with active central banks; extreme oversold conditions on major currency pairs (like EUR/USD or GBP/USD) almost always encounter macro policy intervention or mean-reversion flows.
Should I change standard oscillator settings (e.g., 14 periods) to find oversold levels?
The standard 14-period setting developed by J. Welles Wilder Jr. is universally monitored by institutional algorithms. Shortening the lookback period (e.g., to 7 or 9 periods) makes the oscillator more sensitive and generates more frequent oversold signals, but increases the rate of false breakdowns. Lengthening the period (e.g., to 21 or 25) smooths the data for longer-term swing trading.
Ready to trade forex?
Open a free demo account with a regulated broker. Practice with virtual funds before risking real money.