Overbought
Overbought describes a market condition in which an asset's price has experienced a rapid, sustained, and mathematically extreme upward advance without meaningful consolidation, pushing momentum oscillators into upper statistical thresholds and indicating heightened vulnerability to a price pullback or consolidation.
What Does Overbought Mean?
In financial technical analysis, overbought refers to a market state where intense buying pressure has driven an asset’s price upward at an unsustainable rate or to an extreme statistical deviation from its historical mean. When a market becomes overbought, upside momentum has outrun underlying fundamentals or immediate order book depth, creating an environment where demand is saturated and the balance of risk increasingly favors short-term profit-taking, consolidation, or a corrective pullback.
Overbought conditions are primarily identified using momentum oscillators (such as the Relative Strength Index, Stochastic Oscillator, or Williams %R) and volatility envelope bands (such as Bollinger Bands).
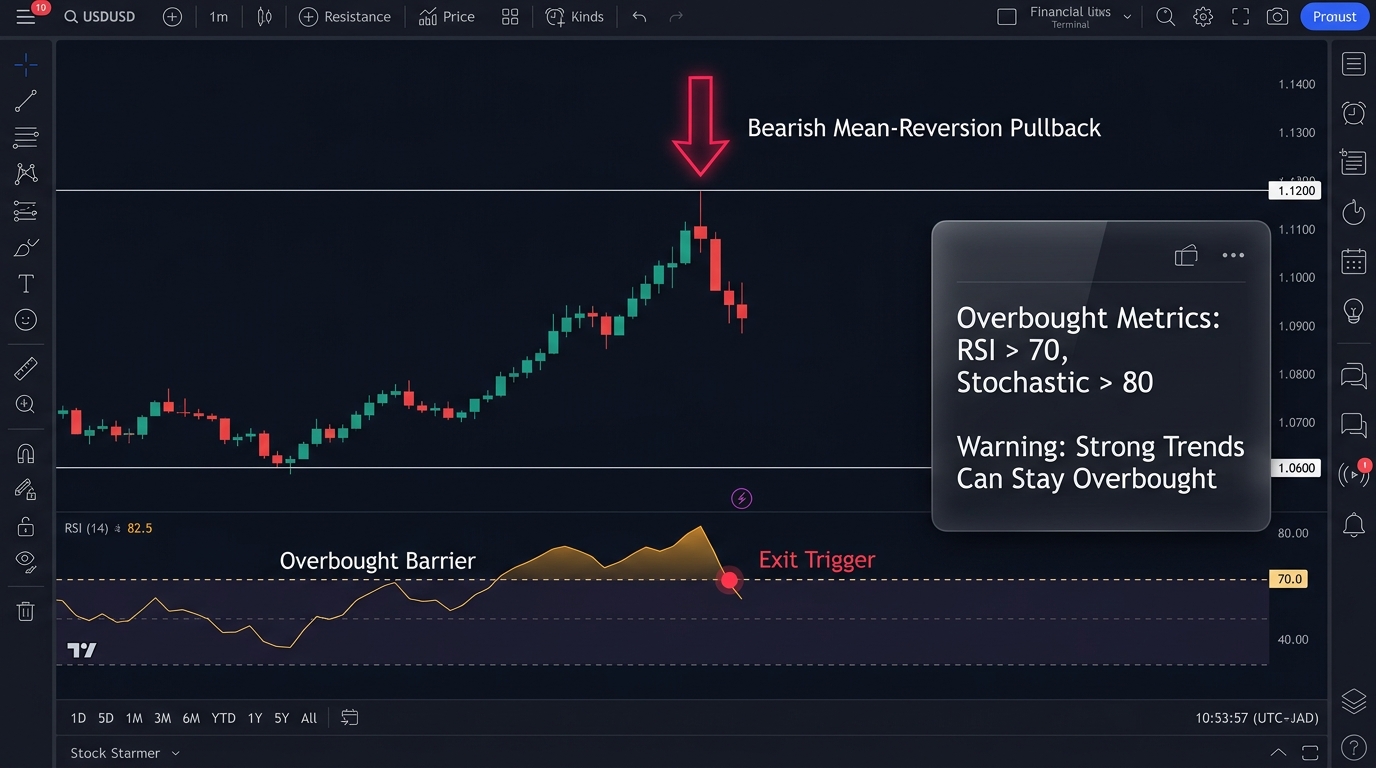
                    OVERBOUGHT EXHAUSTION DYNAMICS

  Price Action ($)
  1.1200 |                               * (Exhaustion Top)
  1.1000 |                       * * * *
  1.0800 |               * * * *
  1.0600 |       * * * *
  -------+-------+-------+-------+-------+-------------------> Time

  RSI (14-Period)
     100 + - - - - - - - - - - - - - - - - - - - - - - - - - -
      80 |                       * * * * (Extreme Overbought)
      70 | - - - - - - - - - - * - - - - - - Overbought Line -
      50 |             * * * *
      30 |     * * * *
       0 + - - - - - - - - - - - - - - - - - - - - - - - - - -
Technical Indicators Used to Measure Overbought Conditions
Technicians deploy various mathematical formulas to quantify overbought thresholds:
| Indicator | Overbought Threshold | Calculation Logic | Practical Market Interpretation |
|---|---|---|---|
| Relative Strength Index (RSI) | RSI > 70 (or > 80 in strong bull trends) | Compares average gains to average losses over 14 periods. | Buying momentum is overextended; watch for bearish divergence. |
| Fast / Slow Stochastic | %K or %D > 80 | Measures current close relative to the high-low range over $n$ bars. | Closing near the absolute top of the range; reversal risk rises. |
| Bollinger Bands | Price touching / piercing Upper Band (+2$\sigma$) | Evaluates price standard deviations above a 20-period moving average. | Statistically rare price deviation (top 2.5% of normal distribution). |
| Williams %R | %R between -20 and 0 | Inverse oscillator measuring proximity to the $n$-period high. | Immediate short-term buying exhaustion. |
| Commodity Channel Index (CCI) | CCI > +100 (or > +200) | Measures price deviation from statistical moving average mean. | Strong cyclical impulse; vulnerable to mean-reversion. |
The Danger of Shorting Simply Because a Market Is Overbought
The most critical mistake made by novice and retail traders is treating an “overbought” oscillator reading as an automatic sell signal.
In market microstructure:
- Strong Trends Stay Overbought: In a powerful institutional bull market, heavy capital inflows and fundamental catalysts can keep an indicator like the RSI pinned above 70 for weeks or even months.
- Momentum Confirmation: A move into overbought territory is often the confirmation of strong trend initiation, not a signal of trend death. Parabolic breakout moves frequently begin with an overbought signal.
- The Short Squeeze Trap: Shorting an overbought market without a structural price reversal pattern (such as a breakdown below previous swing support) exposes traders to catastrophic short squeezes.
       MOMENTUM PINNING VS. BEARISH EXHAUSTION

  [Trend Continuation]     RSI > 70 ---> Price continues rallying +500 pips!
                                         (Overbought = Bullish Confirmation)

  [True Reversal Setup]   RSI > 70 ---> Bearish Divergence (Lower RSI peak)
                                         + Breakdown below Key Swing Low
                                         (Overbought + Structural Shift = Short Signal)
High-Probability Methods to Trade Overbought Conditions
Professional quantitative and discretionary traders require multiple confluence filters before acting on an overbought reading:
1. Wait for Oscillator Exit (Cross Back Below Threshold)
Rather than shorting when RSI crosses above 70, disciplined traders wait until RSI crosses back down below 70. This confirms that upside velocity has officially decelerated and sellers are beginning to overpower buyers.
2. Bearish Divergence Confirmation
If the price prints a Higher High while the oscillator prints a Lower High, a momentum divergence exists. This proves that despite higher nominal prices, the volume and velocity driving the advance are deteriorating.
3. Confluence with Higher-Timeframe Structural Resistance
An overbought reading on a 1-hour chart carries 10x higher probability when it aligns with a major multi-year horizontal resistance level, psychological round number, or descending trendline on the Daily or Weekly chart.
Real-World Case Study: USD/JPY Overbought Pinning in 2022
During the historic Federal Reserve tightening cycle of 2022, the Bank of Japan maintained negative interest rates (-0.10%) while the Fed aggressively hiked rates from 0.25% to 4.00%.
- The Move: USD/JPY initiated a relentless rally from 115.00 in March 2022 to over 151.90 by October 2022.
- The Oscillator Trap: On the Daily chart, the 14-period RSI crossed above 70 in mid-March at 119.50.
- The Trapped Sellers: Retail traders attempting to short USD/JPY purely because it was “statistically overbought” were forced into serial margin calls as the pair rallied another 3,200 pips over the next seven months with the RSI repeatedly surging above 80.
- The Valid Reversal: It was not until October 2022—when the Ministry of Finance conducted direct currency intervention combined with a massive bearish daily RSI divergence at 151.90—that the trend reversed, sending USD/JPY back down to 127.20.
Frequently Asked Questions
What is the exact opposite of overbought?
The direct opposite of overbought is oversold, which describes a market where rapid, aggressive selling has driven prices down to extreme statistical levels (e.g., RSI < 30), indicating that selling momentum may be exhausted and vulnerable to a bullish bounce.
Can a stock or currency remain overbought indefinitely?
No asset can remain overbought indefinitely, but strong institutional trends can maintain overbought readings across multiple weeks. Eventually, either price will correct downward through a sharp pullback, or price will consolidate sideways until the oscillator resets back toward the neutral 50 centerline.
Which timeframe is best for identifying overbought conditions?
Daily and 4-hour charts provide the most reliable overbought signals for swing traders, as they filter out intraday noise. While overbought signals appear frequently on 1-minute and 5-minute charts, their predictive validity is low unless traded strictly in the direction of the higher-timeframe trend.
Ready to trade forex?
Open a free demo account with a regulated broker. Practice with virtual funds before risking real money.